

If you manage marketing across multiple platforms, you already know the pain. Google says one thing. Meta says another. Your CRM has a third number. And somehow you’re supposed to tell the CFO which channel is actually working.
Marketing analysts spend 15-20+ hours per week just compiling reports from different platforms. By the time the deck is ready, the data is already stale and the optimization window has closed.
The problem isn’t your team. It’s your architecture. You’re trying to make unified decisions from fragmented data.
Today I’m going to break down what Unified Marketing Measurement (UMM) actually is, how it utilizes Marketing Triangulation to fix your data, and why it is the only viable path forward in a privacy-first world.
TL;DR Recommendation
Yes, you need a unified marketing analytics layer, but it has to be:
- Built on a data warehouse you control (BigQuery, Snowflake, etc.) — not just native platform dashboards
- Fed by automated pipelines that standardize metrics across platforms
- Designed for the questions you actually ask — not just the metrics platforms want to show you
This gives you faster decisions, accurate attribution, and the ability to actually prove ROI.
Implementation typically takes 6-12 months for full deployment, but you’ll see value within the first 8 weeks.
Want to Cut This Timeline in Half?
6-12 month implementation can feel daunting. But you don’t have to start from scratch.
Take That Fast Track Approach
We have pre-built data pipelines and dbt models that can get you through Phase 1 (Foundation) and Phase 2 (Dashboards) in as little as 6-8 weeks.
What Is Unified Marketing Measurement (UMM)?
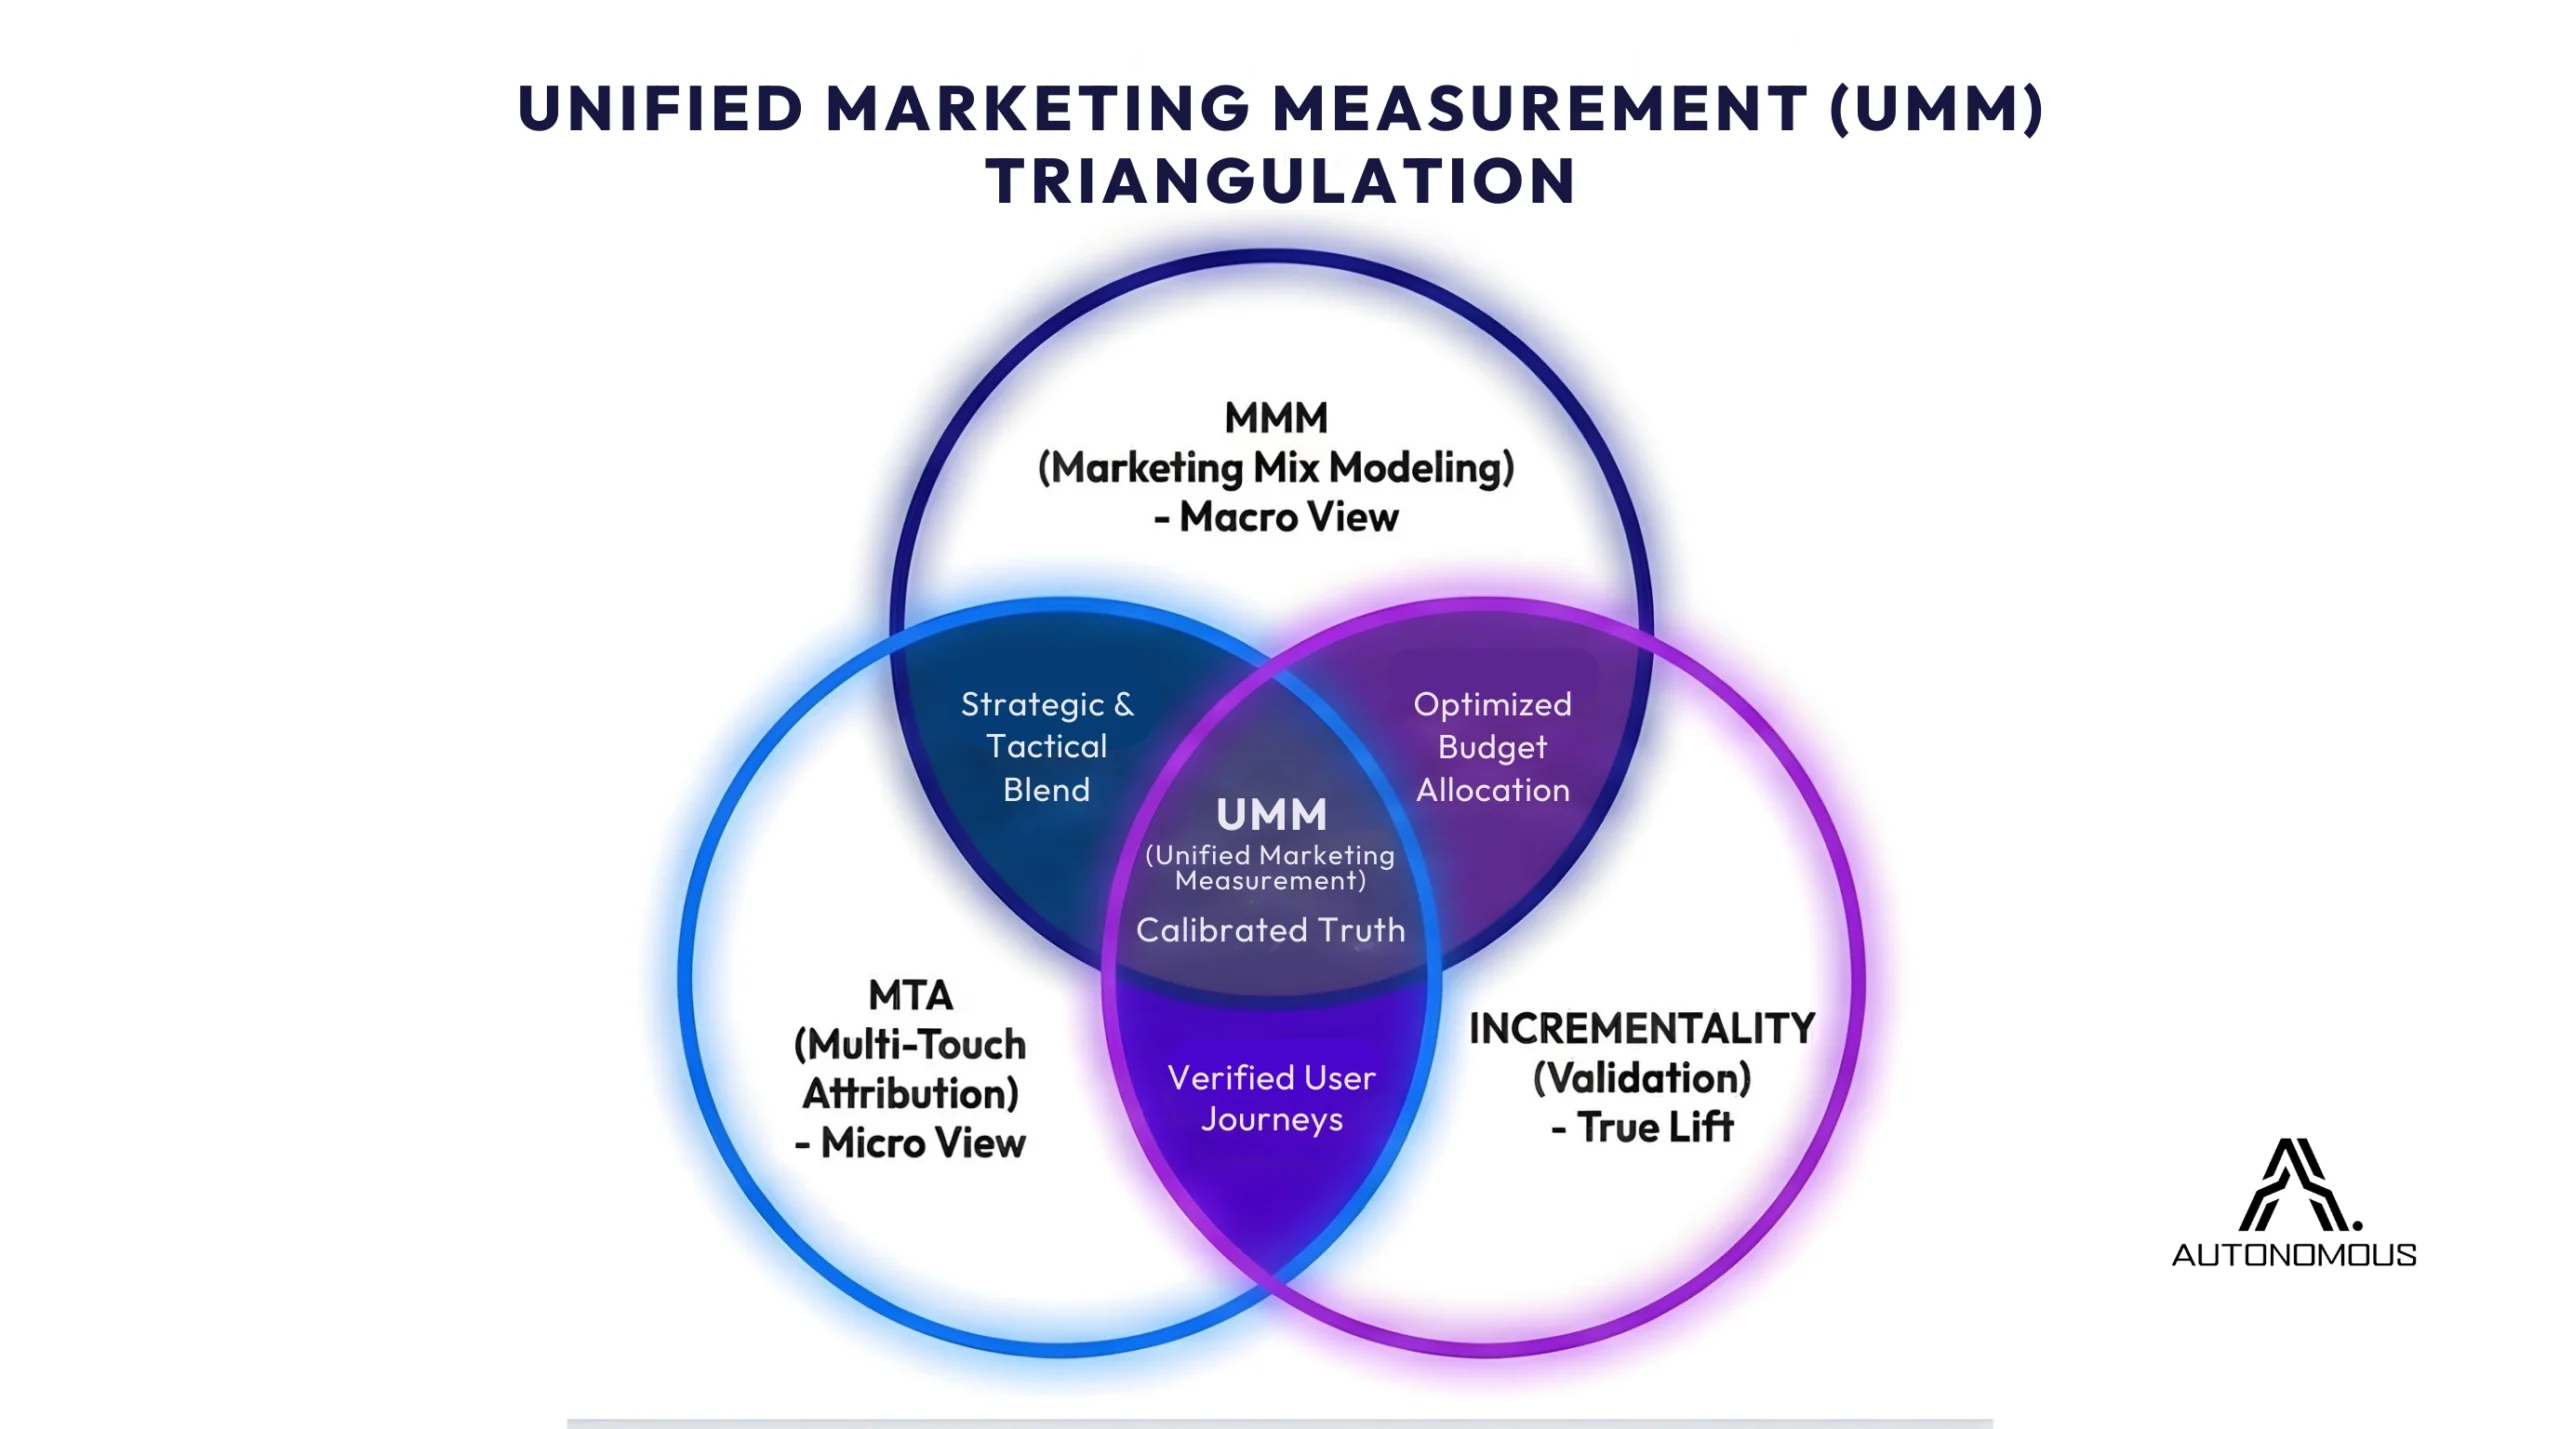
Unified Marketing Measurement (UMM) is a statistical framework that combines the aggregate, privacy-friendly insights of Marketing Mix Modeling (MMM) with the granular tracking of Multi-Touch Attribution (MTA).
Often referred to as “Marketing Triangulation,” this approach allows marketers to validate campaign performance by calibrating granular user data against top-down trends, ensuring accuracy even without tracking cookies.
It’s not just “connecting your ad accounts to a BI tool.”
A real unified analytics layer does three things:
- Aggregates raw data from Google Ads, Meta, LinkedIn, Microsoft, TikTok, etc. into one place
- Standardizes the metrics so “conversions” means the same thing everywhere
- Connects to your actual business outcomes (revenue, LTV, pipeline) — not just platform-reported conversions
Most “dashboards” do #1 poorly and skip #2 and #3 entirely.
The “Why Now?” Factor: Privacy & The Death of Cookies
Why is UMM trending now? Because the old way of measuring is breaking.
For years, marketers relied on MTA (Multi-Touch Attribution), which uses cookies to track users across the web. But since iOS 14.5+, the death of third party cookies, and stricter privacy laws (GDPR/CCPA), tracking pixels are going dark.
- The Problem: You can no longer see every touchpoint in the user journey.
- The Solution: UMM doesn’t rely solely on fragile cookies. It uses MMM (Marketing Mix Modeling), which looks at aggregate data and doesn’t need user IDs, to fill in the blind spots left by privacy blocks.
This is privacy centric measurement: getting the truth without needing to spy on every single user click.
MMM vs. MTA vs. UMM: The Comparison Matrix
This is the question I get asked most often, so let’s break it down:
| Feature | MMM (Marketing Mix Modeling) | MTA (Multi-Touch Attribution) | UMM (Unified / Triangulation) |
|---|---|---|---|
| View | Top-down (Macro view of all channels) | Bottom-up (Micro view of user journey) | Holistic (Calibrated view) |
| Best For | Budgeting, Strategy, & Offline Media | Day-to-day Optimization & Creative Testing | True ROI & Incrementality |
| Data Speed | Slow (Historical analysis) | Fast (Real-time) | Agile (Continuous calibration) |
| Privacy | High (No user data needed) | Low (Dependent on cookies/IDs) | High (Balanced approach) |
| Blind Spots | Misses granular campaign details | Misses offline & "untrackable" views | Minimizes blind spots |
The key insight: Neither MMM nor MTA alone tells the full story. UMM is how you get to “marketing’s single source of truth.”
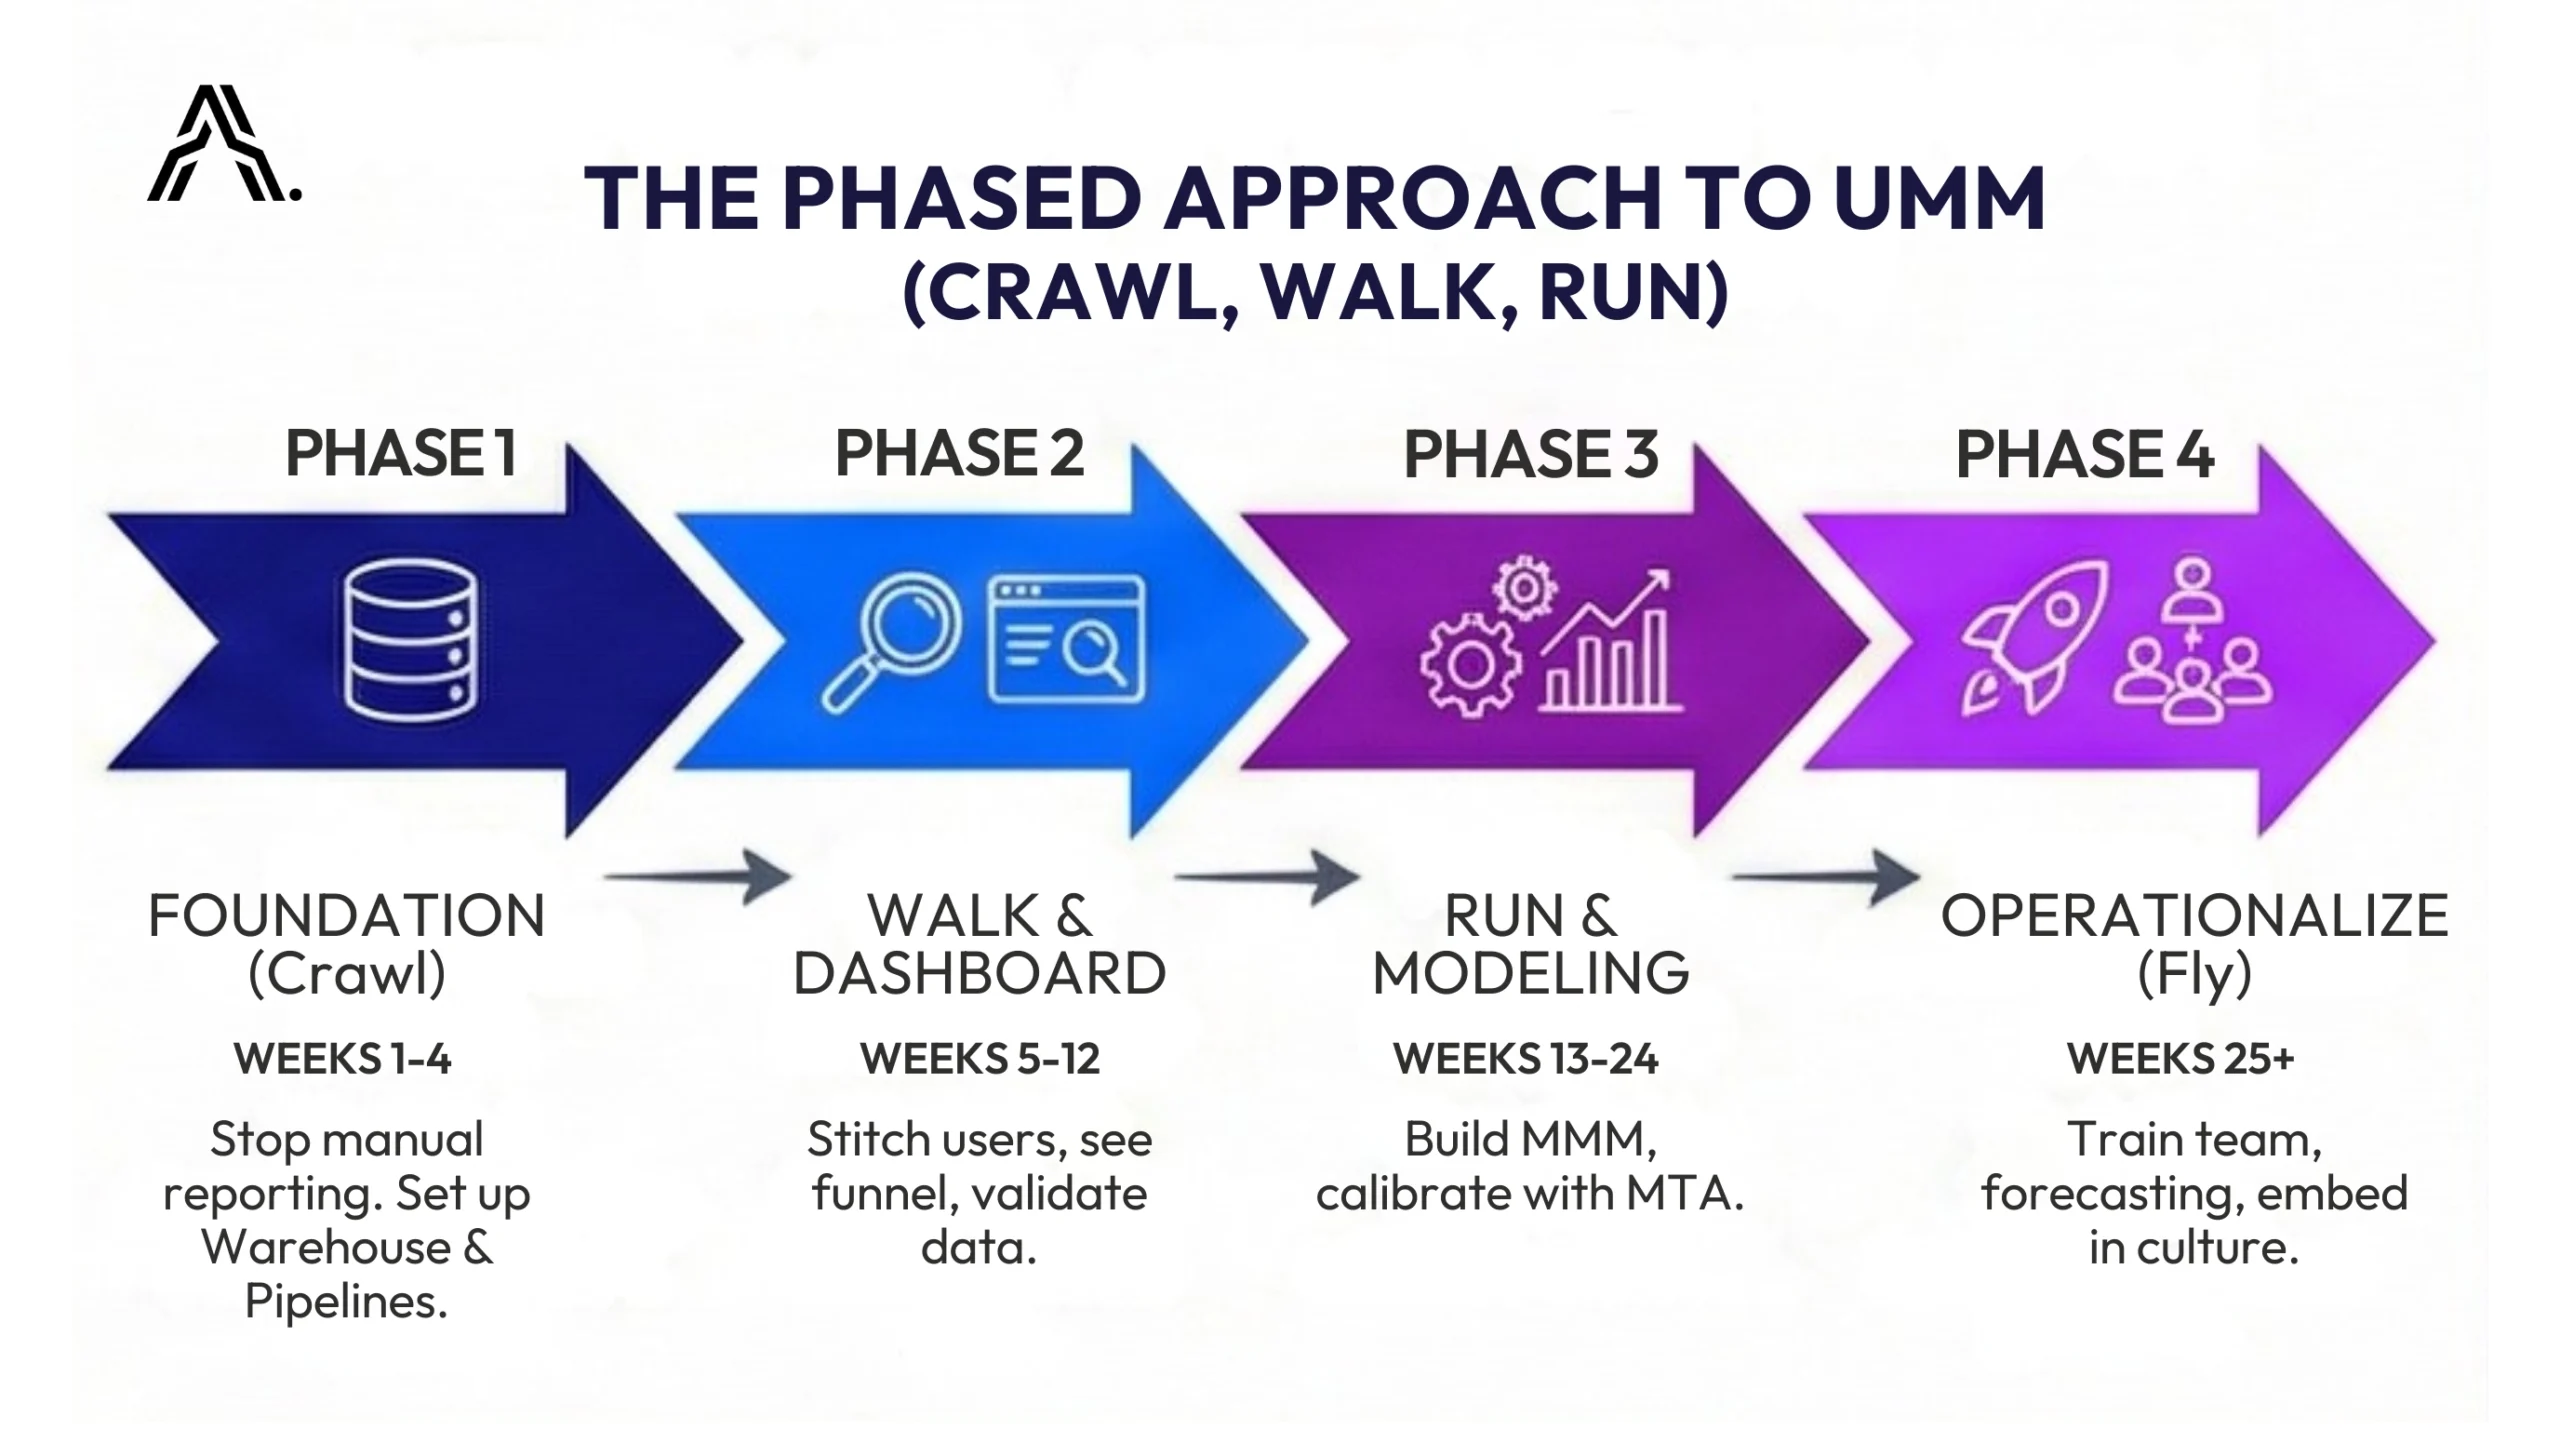
How Do You Implement Unified Marketing Measurement? The Phased Approach to UMM (30-60-90 Day Wins)
Implementation typically takes 6-12 months for a fully mature system, but you do not wait that long for value. We break implementation into a phased “Crawl, Walk, Run” approach.
Book a Measurement Strategy Session
We will map out your specific Phase 1-4 timeline, identify your data sources, and give you a clear project plan before you write a single line of code.
Phase 1: Data Foundation (Weeks 1-4)
Goal: Stop manual reporting.
- Set up cloud data warehouse (BigQuery, Snowflake, Redshift)
- Configure automated pipelines from all ad platforms
- Define standardized metrics (make “Cost per Acquisition” mean the same thing everywhere)
Result: You save 15+ hours/week on manual data entry.
Phase 2: The “Walk” Phase (Weeks 5-12)
Goal: See the full funnel.
- Connect ad data to CRM/Revenue data
- Establish Identity Resolution to stitch user sessions across devices Define standardized metrics (make “Cost per Acquisition” mean the same thing everywhere)
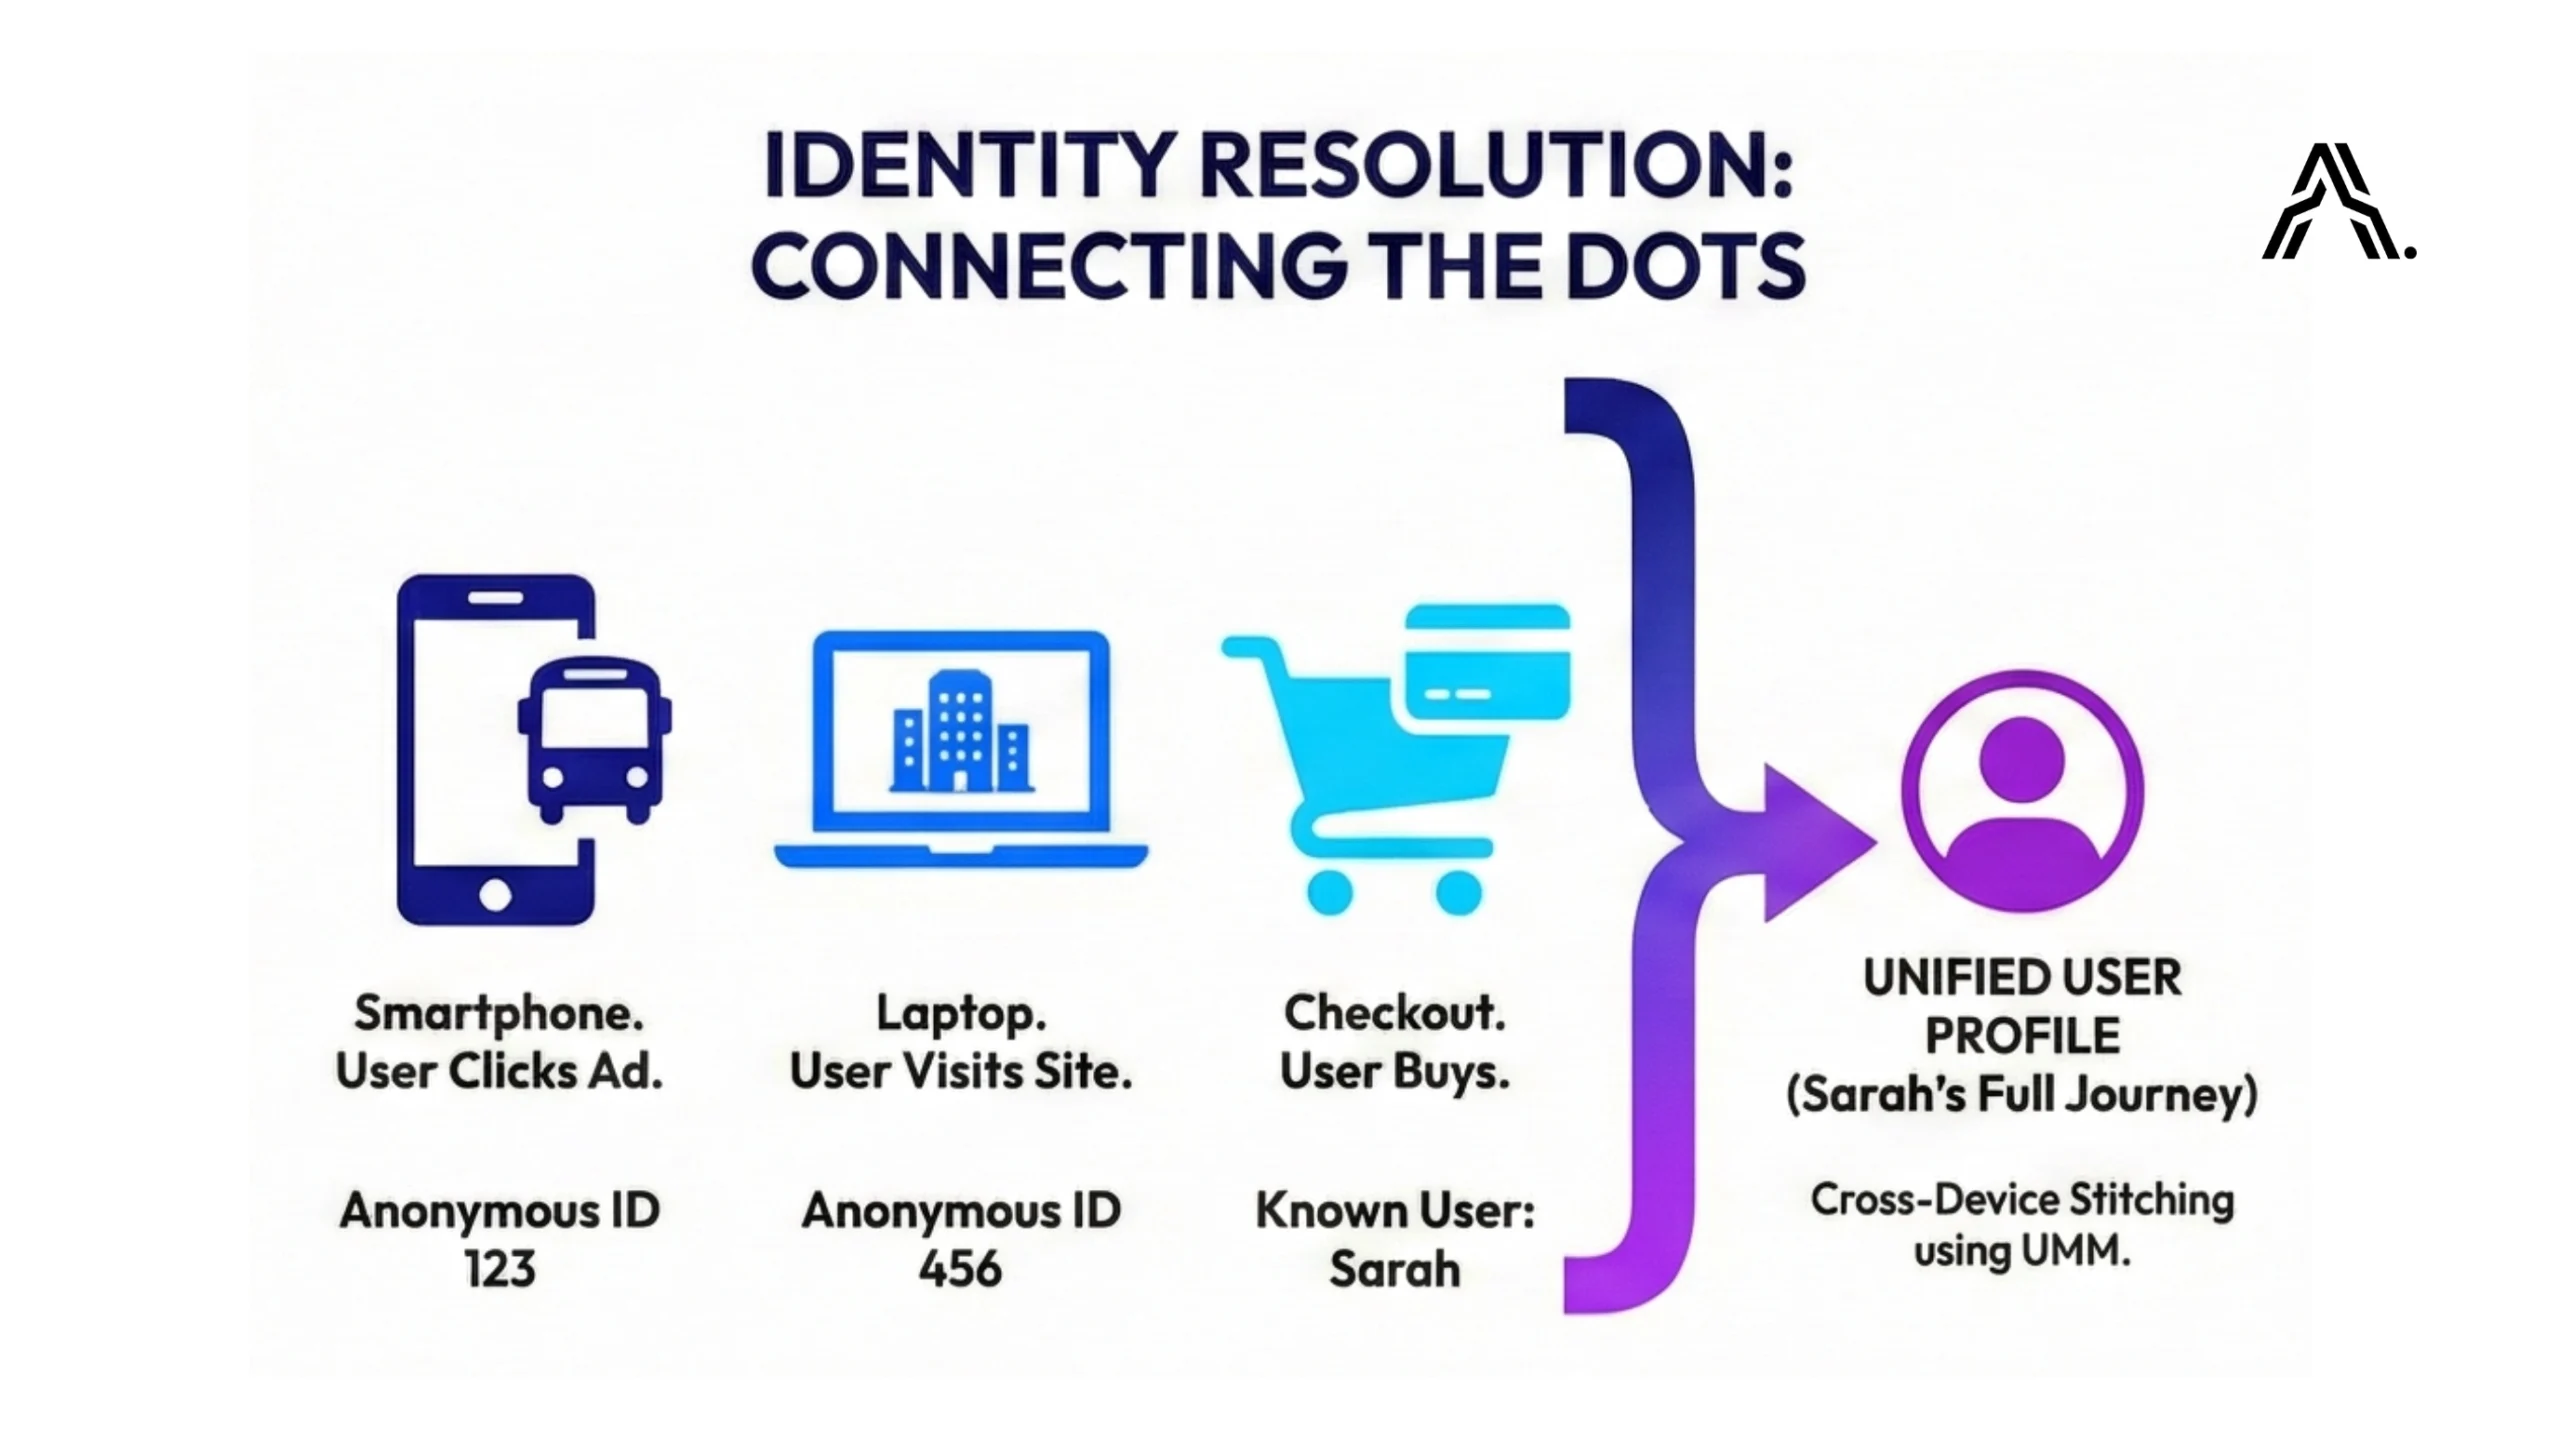
- Implement basic MTA with available user-level data
- Build initial dashboards (Looker/Tableau) to visualize and validate the new attribution data immediately.
Result: You can finally report on Revenue and attribution paths, not just Clicks.
Phase 3: The “Run” Phase (Weeks 13-24+)
Goal: True Incremenality.
- Develop MMM with 2+ years historical data
- Create the calibration layer that reconciles MMM and MTA
- Validate models using Incrementality Testing (lift studies)
Result: You have a “Triangulated” view of performance that doesn’t rely on cookies.
Phase 4: Operationalization (Weeks 25+)
Goal: Emed into culture.
- Train teams on interpretation (moving from “last-click” to “incremental” thinking)
- Establish governance and update cadence for models
- Integrate into budget planning cycles
Result: The data actually drives financial decisions.
Timeline reality check: Full UMM implementation takes 6-12 months. But you don’t need the full system to start getting value. Even Phase 1 alone eliminates most manual reporting pain.
Why Platform-Native Reporting Doesn’t Cut It
Every ad platform has its own reporting interface. They’re free. They’re easy. And they’re lying to you.
Here’s why:
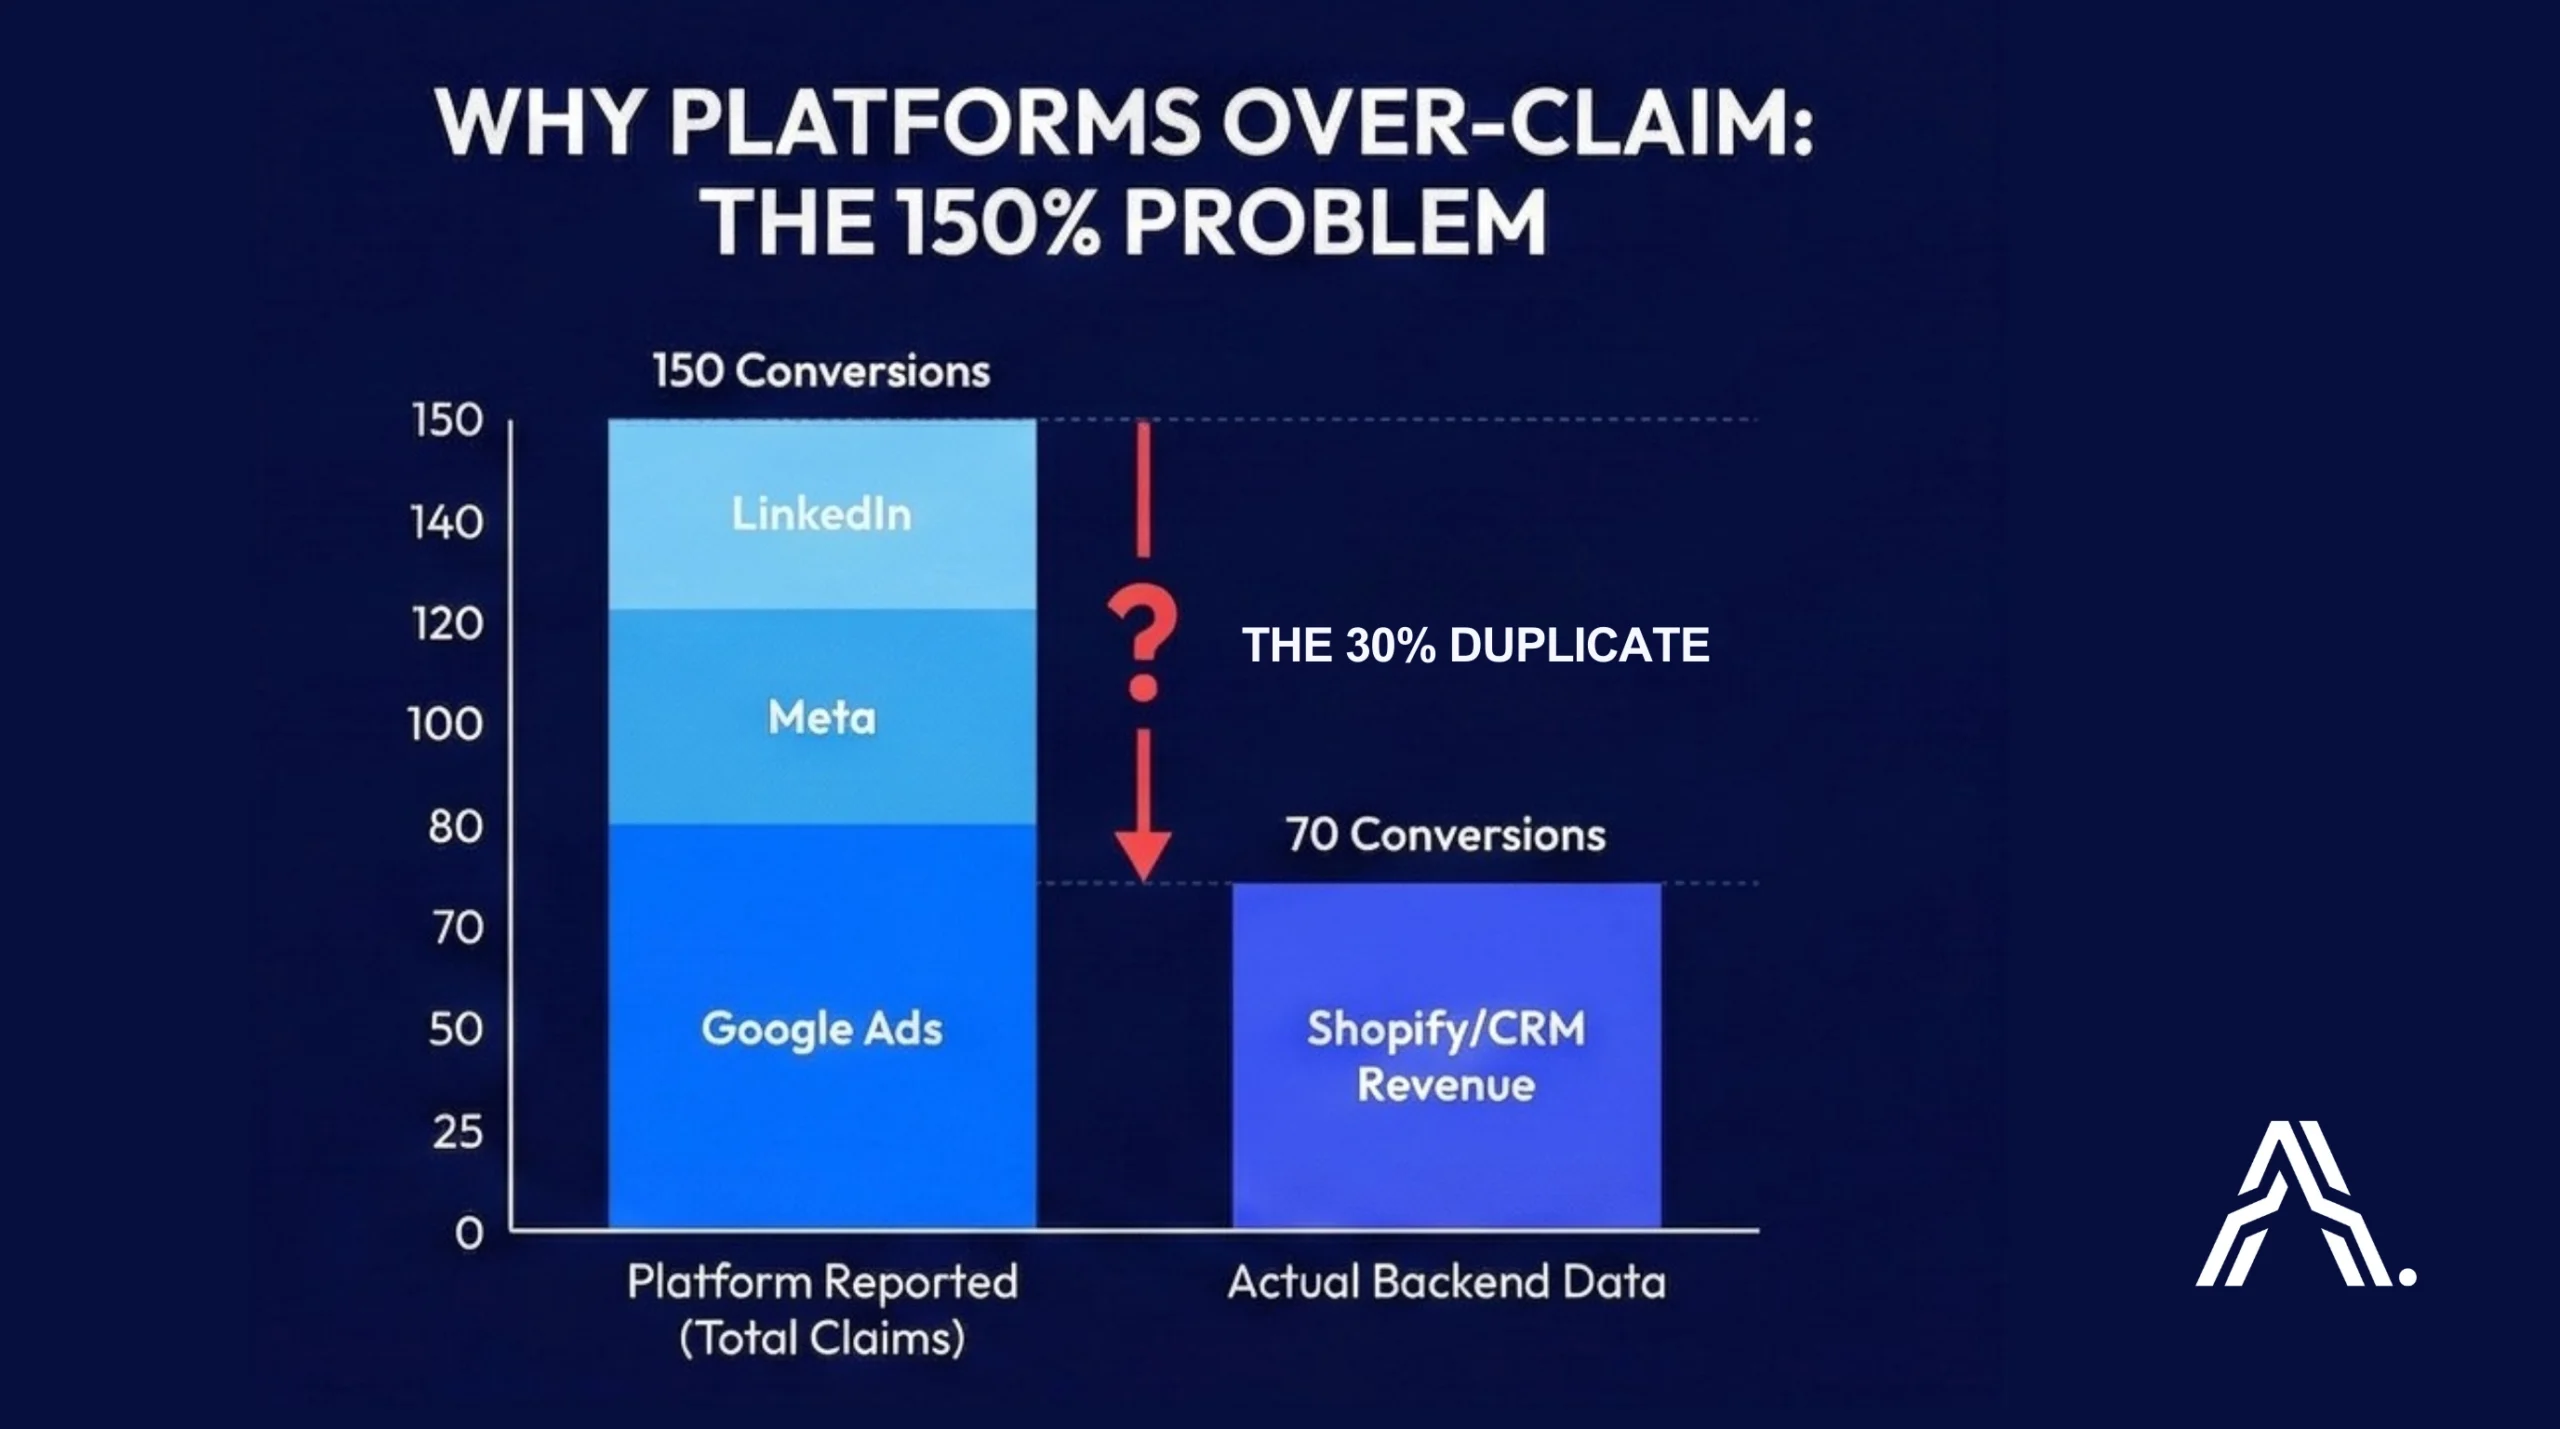
Each platform wants credit. Meta’s attribution model is designed to make Meta look good. Google’s is designed to make Google look good. When you add them up, you get 150% attribution because everyone’s claiming the same conversions.
Metrics aren’t standardized. “Cost per conversion” in Google Ads isn’t calculated the same way as in Meta. Time zones differ. Attribution windows differ. You’re comparing apples to algorithmic oranges.
You can’t see the full funnel. Platform dashboards show you what happened on their platform. They don’t show you what happened after the click — the website behavior, the nurture sequence, the sales call, the actual revenue.
The data is siloed. Want to know “which campaigns drove customers with the highest LTV”? Good luck answering that in Facebook Ads Manager.
Is Your Data Architecture Leaking ROI?
You can’t fix what you can’t see. Most marketing stacks have hidden silos that block true attribution.
Claim Your Free MarTech Stack Blueprint
Get a complimentary MarTech Gap Analysis. We’ll review your current setup (Ad Platforms, GA4, CRM) and show you exactly where your data is breaking down, before you spend another dollar on ads.
What Are the Benefits of Unified Marketing Analytics?
Concrete benefits you can expect:
| Benefit | Typical Impact |
|---|---|
| Reduced reporting time | 75-85% reduction in manual analyst hours |
| Faster decision-making | Days → hours for ROI questions |
| Budget optimization | 10-25% improvement in marketing efficiency |
| Finance credibility | Single source of truth eliminates conflicting numbers |
| True attribution | See actual incrementality, not platform-inflated ROAS |
The CFO question is the key test: When someone asks “what’s our blended CAC?” and it takes three days to answer, you have an architecture problem. With UMM, that answer comes in seconds.
The Real Cost of Fragmented Data
Let’s be concrete about what fragmentation costs you:
| Problem | Business Impact |
|---|---|
| Manual report compilation | 15-20+ analyst hours/week wasted |
| Stale data | Optimization decisions made on week-old numbers |
| Conflicting metrics | Leadership loses trust in marketing's numbers |
| No cross-channel view | Budget misallocated to channels that look good but don't perform |
| Can't prove ROI | Marketing budget is first on the chopping block |
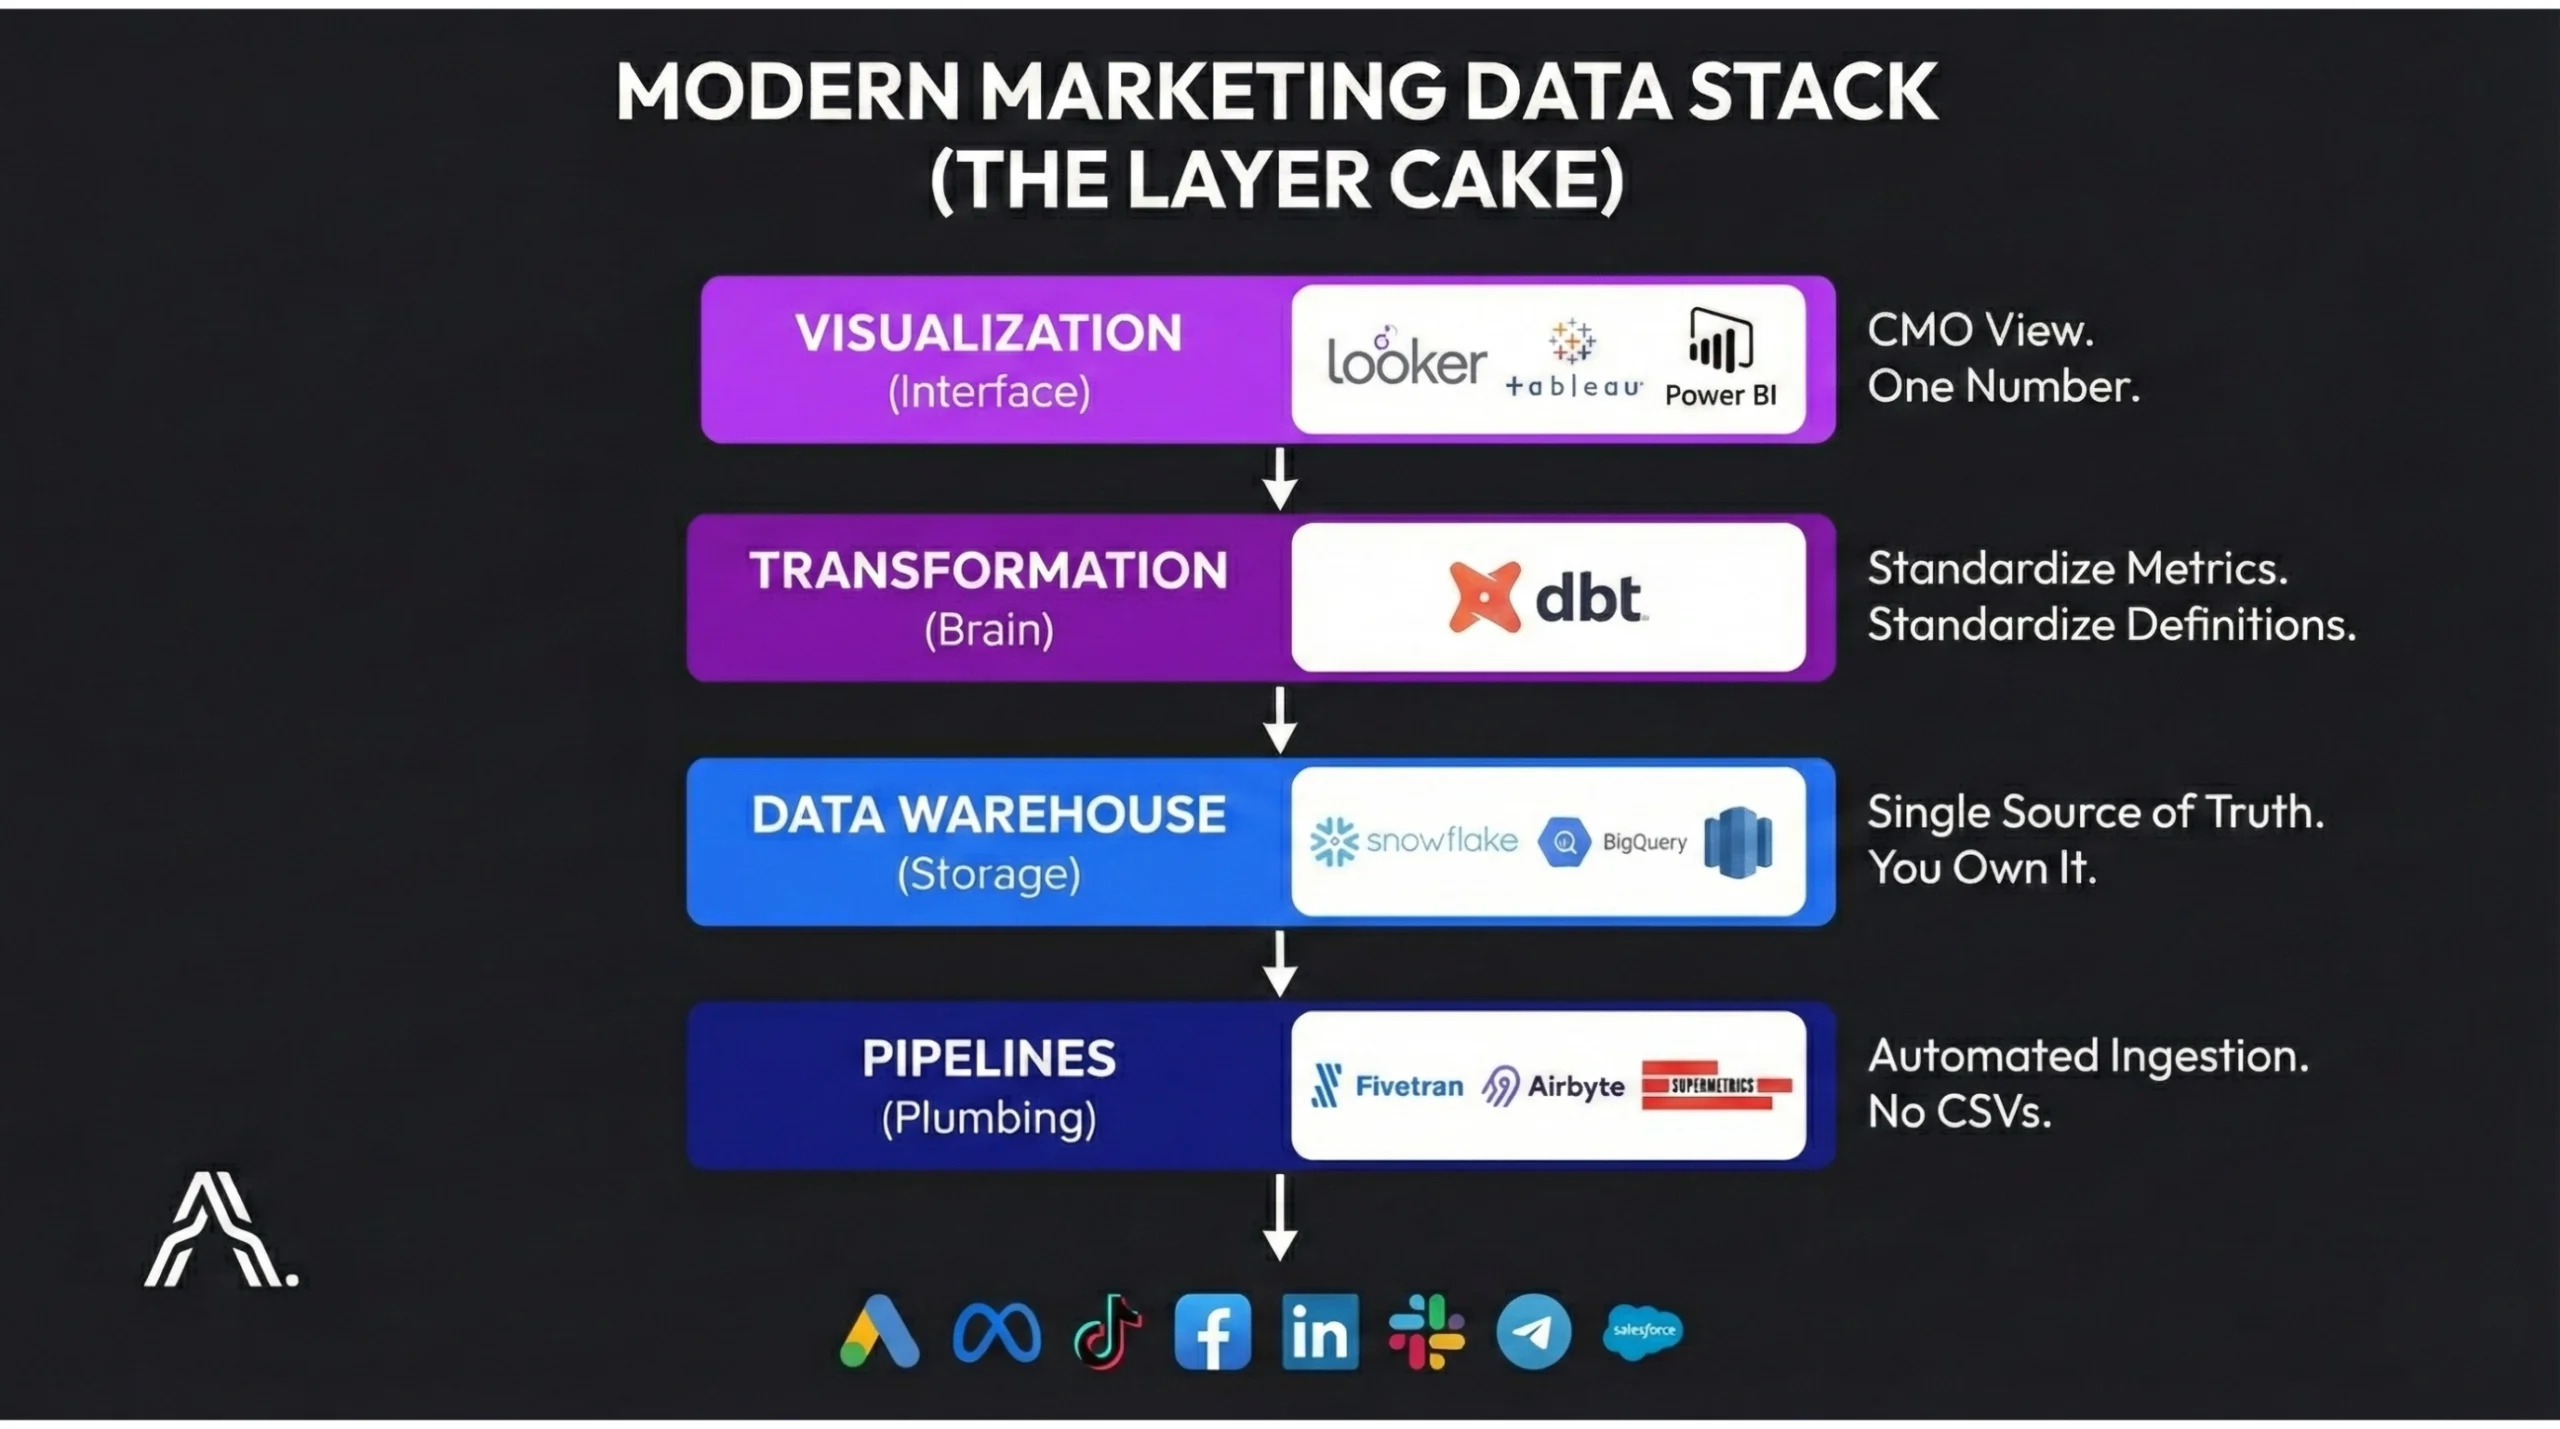
What a Real Solution Looks Like
The companies that actually know their numbers have a specific architecture:
Layer 1: Data Warehouse (The Brain)
All your marketing data flows into a central warehouse — BigQuery, Snowflake, or Redshift. This is your data, in your infrastructure, with your definitions.
Why this matters: You’re not renting insights from platforms. You own the source of truth.
Layer 2: Automated Pipelines (The Plumbing)
Tools like Fivetran, Airbyte, or Supermetrics pull data from every platform automatically. No more manual exports. No more CSV gymnastics.
The data lands in your warehouse in a standardized schema. ‘Spend’ means spend. ‘Conversions’ means conversions. Everywhere.
Layer 3: Transformation (The Translation)
Raw data isn’t useful. You need a transformation layer (usually dbt) that:
- Standardizes metric definitions across platforms
- Joins ad data with CRM/revenue data
- Creates the calculated fields you actually need (ROAS, blended CAC, LTV:CAC)
This is where your ‘Cost Per Acquisition’ finally means the same thing whether it came from Google or Meta.
Layer 4: Visualization (The Interface)
Now, and only now, do you connect a BI tool (Looker Studio, Tableau, Power BI). The dashboard queries your warehouse, not the platforms directly.
The difference: Your CMO sees one number for each metric. Not three conflicting numbers and a shrug.
Is Your Data Foundation Cracking?
You can’t build advanced attribution on a shaky warehouse. We review your schema, pipelines, and dbt models to ensure your foundation is scalable, secure, and cost-efficient.
The Metrics That Actually Matter
Once you have unified data, here’s what to focus on:
| Metric | What It Tells You |
|---|---|
| Blended CAC | True cost to acquire a customer, all channels combined |
| ROAS by Channel | Which platforms are actually profitable (using your revenue data, not platform-reported) |
| LTV:CAC Ratio | Are you acquiring customers profitably? |
| Time to Payback | How long until a customer becomes profitable |
| Contribution by Channel | What % of revenue can you attribute to each channel |
| Incrementality | Did this ad actually cause the sale, or would they have bought anyway? |
Notice these aren’t vanity metrics. You can’t answer “what’s our LTV:CAC ratio by acquisition channel?” in Google Ads. You need unified data.
It can’t all be good, can it?
Real talk: building this isn’t trivial.
It requires investment. Someone needs to set up the warehouse, configure the pipelines, write the transformations. This isn’t a “connect and go” SaaS tool.
It requires maintenance. Platforms change their APIs. New campaigns need new tracking. Someone has to own this.
It requires discipline. Garbage in, garbage out. If your UTM parameters are inconsistent, your unified dashboard will show unified garbage.
It takes time. Expect 6-12 months for full implementation. You can see value sooner, but the complete system takes time.
The question isn’t “is this easy?” It’s “is the alternative acceptable?”
If you’re spending 20 hours a week on manual reporting and still can’t answer basic questions about ROI, the alternative isn’t acceptable.
How to Know If You Need This
You probably need unified measurement if:
- You spend on 3+ ad platforms
- Marketing budget is >$50K/month
- Leadership asks ROI questions you can’t answer quickly
- Your “reports” are actually manual spreadsheet exercises
- Finance and marketing have different numbers for the same metrics
You can probably wait if:
- You’re only on 1-2 platforms with simple tracking
- Marketing budget is small and experimental
- You have a single person who “just knows” what’s working
Summary For Stakeholders
Pros:
- Single source of truth for all marketing metrics
- 75-85% reduction in manual reporting time
- Combines strategic (MMM) and tactical (MTA) measurement
- Better budget allocation based on real performance
- Credibility with finance and leadership
- Privacy-safe future-proofing against cookie loss
Cons:
- Requires data warehouse setup and maintenance
- Needs technical resources (or a partner) to implement
- 6-12 month full implementation timeline
- Ongoing discipline around tracking and UTMs
Our stance:
If you’re spending serious money on marketing and can’t quickly answer “what’s our blended CAC?” or “which channel drives the highest-LTV customers?”, you have a data architecture problem.
Unified marketing measurement isn’t a nice to have — it’s how you prove marketing is an investment, not a cost center. Neither MMM nor MTA alone gives you the full picture. UMM does.
Ready to Turn Marketing Into a Math Problem?
You’ve read the roadmap. You know the “why.” Now it’s time to solve the “how.”
We partner with marketing leaders to design, build, and operationalize Unified Measurement frameworks that Finance trusts.
Get the ROI from your Marketing
We’ll discuss your current stack, your blind spots, and what a 90-day roadmap to “One Number” looks like for your brand.