

If you run an agency, manage multiple dashboards, or oversee analytics-heavy projects, you eventually hit a wall. Your app feels sluggish, your reports take forever to load, and your engineers get nervous every time the marketing team asks for “just one more metric.”
These are the classic signs that it’s time to fix slow dashboards and analytics before they drag your entire workflow down.
The solution isn’t a bigger server. The solution is separating your Operational Database from your Data Warehouse.
Here is the simplest explanation of why you need to do this, and exactly when it becomes worth the investment.
The Basics: OLTP vs. OLAP
Before we look at the why, let’s define the what.
1. Your Operational Database (OLTP)
This is built to run the business.
- Goal: Fast, real-time transactions.
- Workload: Small, frequent reads/writes serving APIs and user actions.
- Examples: PostgreSQL, MySQL, MongoDB, Firebase.
2. Your Data Warehouse (OLAP)
This is built to understand the business.
- Goal: Heavy analysis and reporting.
- Workload: Aggregations, joins, transforms, and ML models.
- Examples: BigQuery, Snowflake, Redshift, ClickHouse.
The Core Problem: If you mix both jobs into the same database, you get pain. Slow dashboards are annoying; a slow app means lost revenue.
7 Reasons You Do Not Want Dashboards Hitting Production
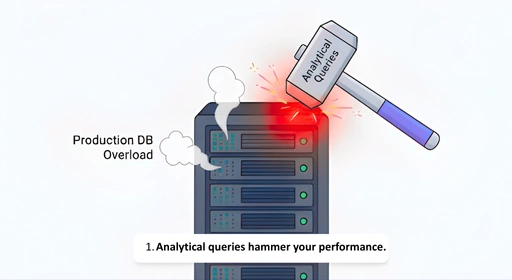
1. Analytical queries hammer your performance
A dashboard query isn’t a simple lookup. It looks like this:
SELECT customer_id, COUNT(*)
FROM orders
WHERE created_at > NOW() - INTERVAL '2 years'
GROUP BY 1;
This forces the database to scan millions of rows. If you run this on your production DB, you are stealing resources from the users trying to log in or make a purchase.
2. Analytics loads grow exponentially
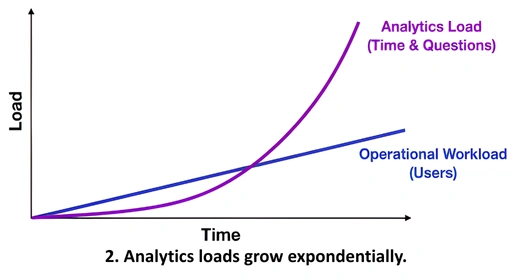
Your operational workload usually grows linearly with your user count. Your analytics load, however, grows exponentially based on time windows and the complexity of questions you ask. Even with only 5k users, your dashboards will eventually need to process tens of millions of historical rows.
3. You need history (OLTP is not built for that)
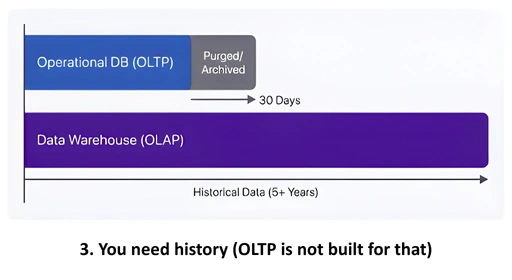
Operational databases are designed to be lean; which means they often purge logs or archive data to stay fast. But to calculate LTV, cohort analysis, or churn prediction, you need infinite history. Your app DB shouldn’t store 5 years of order logs just so you can run a marketing funnel.
4. The schemas conflict
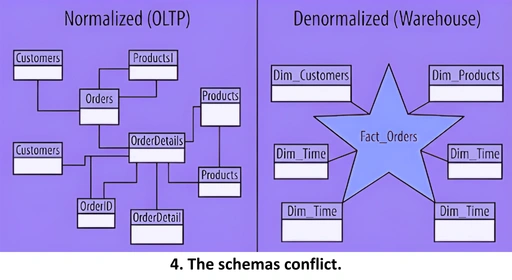
- OLTP Schema: Normalized, optimized for writes, many small tables.
- Warehouse Schema: Denormalized, wide tables, optimized for reads (often Star or Snowflake schemas).
Your app schema is simply not friendly for complex analytics.
5. You need a space for “dirty work” (ETL/ELT)

A warehouse is where you clean, model, and version your data. This is where tools like dbt shine. You perform enrichment, create machine learning features, and build a metrics layer. None of this heavy lifting belongs in your live production environment.
6. You need a Single Source of Truth
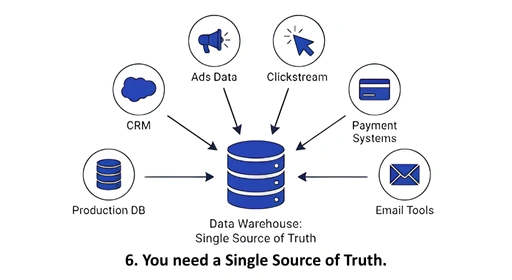
Your app DB is just one input. A true view of your business combines:
- Production DB
- CRM (HubSpot/Salesforce)
- Ads Data (FB/Google)
- Clickstream (PostHog/Segment)
- Payment Systems (Stripe)
The Data Warehouse is the only place where all these diverse sources can live together as one unified truth.
7. Engineers shouldn’t be bottlenecks
If analysts have to query production, they risk locking tables, breaking indexes, or running accidental full table scans. A warehouse gives analysts a safe sandbox to explore data without the risk of taking down the app.
The Honest Threshold: When should you build one?
You don’t need a warehouse on Day 1. But you need one sooner than you think. If any of the following are true, it is time to build:
- You have > 3–4 data sources: As soon as you have Postgres + Stripe + Google Analytics + CRM, a warehouse becomes efficient.
- You need complex metrics: Simple counts are fine in SQL. Cohorts, LTV, ROAS, and retention analysis require a warehouse.
- You want reproducible analytics: If you want version-controlled data models (e.g., fact_orders, dim_customers), you need dbt and a warehouse.
- You are doing ML or Forecasting: Machine learning requires clean historical data and materialized features.
- You are selling to Enterprise: Large clients expect data governance, security isolation, and consistent metrics.
When does it NOT make sense?
Only if you are very small, have a single data source, simple dashboards, and no plans for growth. For almost any digital business past its first year, this is rarely the case.
We’ll audit your current setup, diagnose why your dashboards are slowing down, and map the fastest path to a scalable data warehouse.
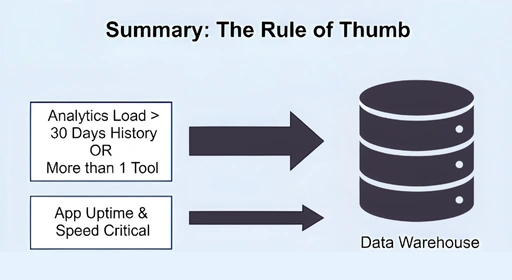
Summary: The Rule of Thumb
You should build a Data Warehouse if your analytics load touches more than one tool or needs more than 30 days of history.
If your app’s uptime and speed are critical to your revenue then you need to separate your analytics immediately.
It’s not just about speed; it’s about clarity. Separating these systems gives you the freedom to scale your operations and your intelligence independently.