

Building a data-first culture in a modern marketing agency often feels like living through a civil war.
On one side, you have the Creative Team. They live in Figma and Premiere Pro, prioritizing brand voice, aesthetic integrity, and emotional hooks. To them, “data” often feels like a constraint – a spreadsheet that kills good ideas simply because they did not “click” immediately.
Conversely, you have the Media Buyers and Analysts. They live in Ads Manager and Looker Studio. They care about ROAS, CTR, and CPA. To them, “creative” is just a variable to be tested, swapped, and killed if it does not perform.
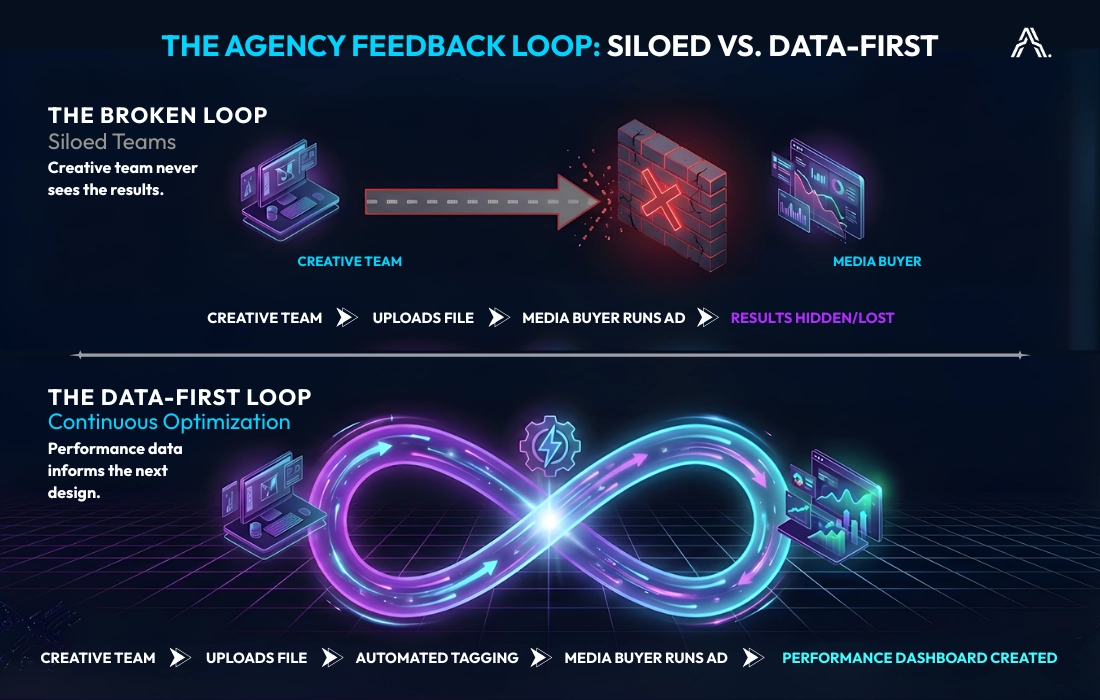
The result is the “Black Box” Feedback Loop.
Creatives ship assets into a void. Media buyers run them without context. If the ad fails the buyer says, “Creative didn’t work.” If it wins, they say, “Great optimization.” The Creative Director never learns why something worked, so they cannot replicate it.
You do not need a culture seminar to fix this. You need better infrastructure.
The Solution: The Autonomous 3-Stage Maturity Model
To diagnose where your agency is failing, we use The Autonomous 3-Stage Maturity Model. This framework helps you identify if your disconnect is cultural or architectural.
Most creative agencies are stuck in Stage 1, trying to pitch Stage 3 results to clients.
| Stage | The Reality | The Pain Point |
|---|---|---|
| Stage 1: The Ad-Hoc Silo | A messy combination of legacy CRMs, disconnected ad accounts, and spreadsheets. | Attribution is a guessing game. You cannot prove ROI because the data is broken. |
| Stage 2: The Architectural Blueprint | The ecosystem is mapped, and APIs are connected. You identify the "Red Flag" silos. | You move from guessing to engineering. This is the foundational step required to automate. |
| Stage 3: The Data-First Ecosystem | Automated ROI tracking and personalized lifecycle marketing (e.g., Segment -> Braze -> Amplitude). | Creative decisions are informed by predictive analytics, not just retrospective reporting. |
Building a data-first culture is not about forcing designers to love spreadsheets. Rather, it is about moving from Stage 1 to Stage 3 by building a backend that translates “Art” into “Data” automatically.
The diagram below visualizes how automating this feedback loop breaks down the wall between creative and media teams.
How to Bridge the Gap: 3 Steps to a Data-First Culture
Moving your creative agency from a Stage 1 “Franken-stack” to a Stage 3 Ecosystem does not happen by accident. It requires implementing specific operational protocols that allow your Creative and Media teams to speak the same language.
Here are the three foundational pillars you need to build.
1. Implement a Creative Taxonomy
But before we even move ahead on how to implement it, we need to know first what the heck is Creative Taxonomy?
Creative Taxonomy is a standardized naming convention system that allows data engineers to track specific attributes of a creative asset, such as hook type, visual style, or concept ID.
The first step is standardization.
The Golden Thread: The number one reason your data culture is failing is not mindset but file naming. If your designers are saving files as Client_Summer_Promo_Final_v3.mp4 you have already lost.
A data engineer looks at that filename and sees nothing because there is no metadata. To build a quantitative culture, you need a rigid Creative Taxonomy. Specifically, every asset needs to be tagged with variables that a machine can read:
- Concept ID: (e.g. CON-001 : “UGC Unboxing”)
- Format: (e.g. 9×16)
- Hook Type: (e.,g. Question, Shock, Benefit)
- Visual Style: (e.g. Live Action, Animation)
When you enforce this structure – often via a standardized intake form or DAM system – you stop tracking “Ads” and start tracking “Attributes.”
Suddenly, you are not saying “This video failed.” Instead, you are saying “Live Action videos with Question Hooks are outperforming Animation by 40%.”
That is language a Creative Director respects because it is actionable.
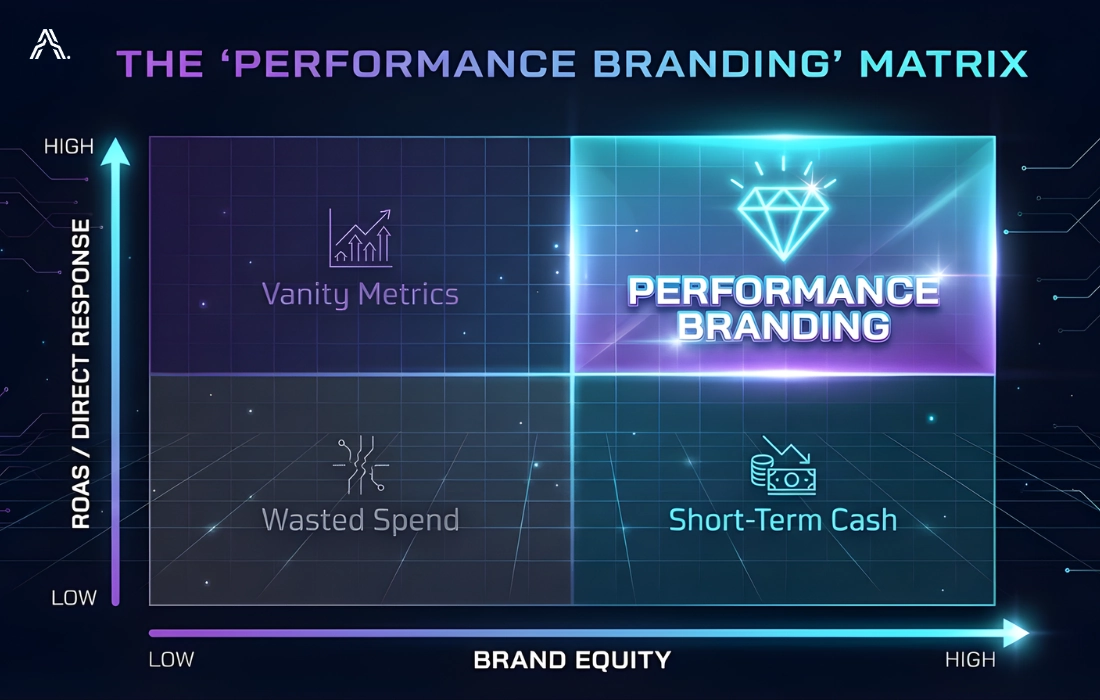
2. Shift to Performance Branding
Once your taxonomy is in place, you can shift your methodology. The old way was strictly separating “Brand Awareness” (Creative) from “Direct Response” (Performance). However, the new standard is Performance Branding. Let’s just get a refresher on what Performance Branding is now, shall we?
Performance Branding is a methodology that uses real-time data to inform creative decisions, acknowledging that every brand impression is also a performance opportunity.
This methodology uses real-time data to inform the creative before the brief is even written.
How Engineering Supports This:
- Automated Creative Scoring: We can build scripts that pull ad performance data via an API and map it back to those Taxonomy tags we created in Step 1.
- Visual Dashboards: Instead of rows of numbers we build visual dashboards – using tools like Looker or Tableau – that display the thumbnail of the ad next to its ROAS.
When a designer sees their artwork next to a green “High ROAS” bar the culture shifts instantly. They stop fearing data and start treating it like a game they want to win.
The matrix below helps identify where your agency’s output sits on the spectrum between pure art and pure profit.
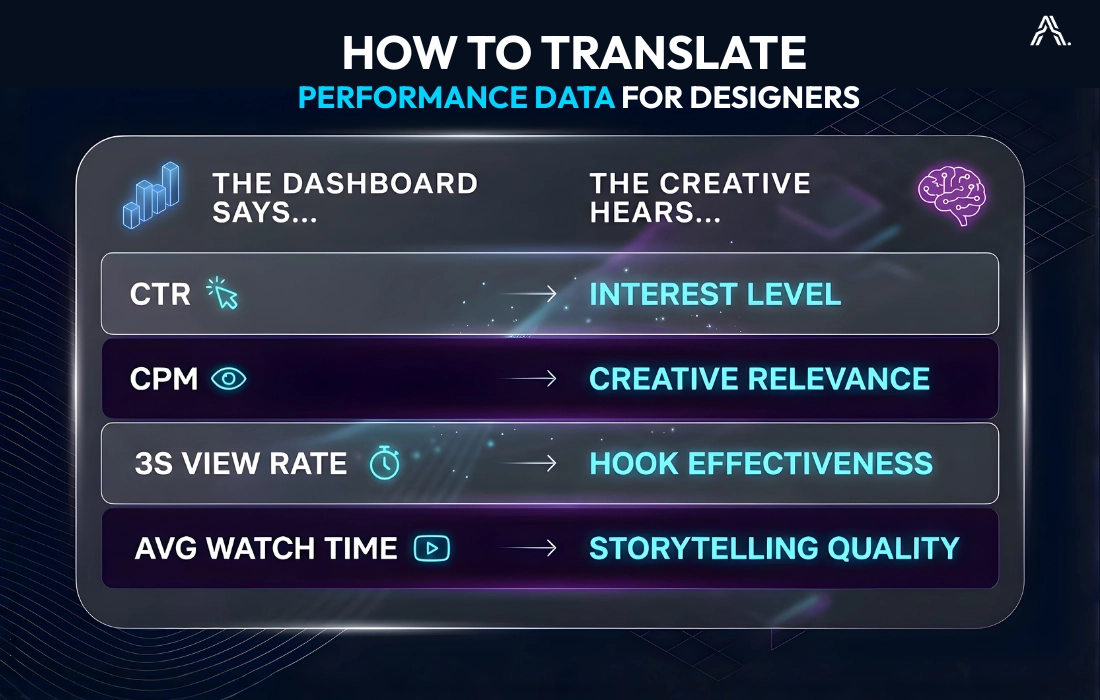
The Execution Gap: Why You Need a “Data Translator”
You might be reading this thinking: “This sounds great but my Creative Director doesn’t know SQL and my Media Buyer can’t code Python scripts.”
This is the most common point of failure. You cannot expect creatives to become data scientists nor can you expect analysts to understand color theory.
This is where the role of the “Data Translator” comes in.
Whether you hire for this role or partner with a White-Label Marketing Ops team like ours you need a translation layer. We build the “pipes” that connect your creative tools – like Frame.io or Google Drive – to your performance tools – like Meta Ads Manager.
We automate the boring stuff so your teams do not have to:
- Ingesting Creative Data: Pulling spend and conversion data for every single asset.
- Standardizing Metrics: Calculating “Thumbstop Rate” (3-second views / Impressions) so video editors know if their hook worked.
- Delivering the News: Pushing these insights back into the tools your team actually uses.
What You Get:
- The Visual Architecture Map: See exactly how data moves – or does not move – in your client’s ecosystem.
- The “Red Flag” Report: We identify the critical data silos and broken tags that are leaking revenue.
- The “Aspirational” Roadmap: A step-by-step plan to move from your current “Franken-stack” to the “Dream Stack.”
Ending the Civil War
Ultimately, a data-first culture does not mean creativity is dead. It means creativity is verified.
When you bridge the gap between art and analytics, you move your agency from “We think this looks cool” to “We know this drives revenue.” That is the shift that allows you to charge premium retainers, end the internal blame game, and move from being a replaceable vendor to a strategic partner.
Your creatives want to win. They just need a scoreboard they can actually read.
Is your creative team flying blind?
If your feedback loop is broken, you are burning client budget on assets that will never convert.
Let us audit your creative data pipeline and build a feedback loop that actually works.