

If you sell performance marketing, lifecycle strategy, or attribution, your real product is not just ads and creative. Your real product is the data underneath everything.
And for many brands, that data lives inside a Frankenstack.
A Frankenstack forms when tools get added one at a time with no real plan. On the surface, things look fine. Under the hood, nothing lines up. This is exactly what a Martech stack audit is designed to uncover.
In this post, we break down the five most common signs your clients tools are not talking to each other, what each one costs you, and how a Martech stack audit helps you regain control. If you spot even one of these signs in an active account, hidden risk already exists.
Why the Frankenstack Is an Agency Problem
Most clients do not know their stack is broken. While they might see leads coming in, tracking revenue accurately in Shopify or Stripe is a different story. From their side, things feel fine.
For agencies, however, the damage is real.
A broken stack means:
- ROI is hard to prove
- Attribution relies on guesses
- Automations fail quietly
- Reporting eats hours
- You look bad when the tech breaks
You end up defending results instead of growing accounts. Worse, you get blamed for problems that are not creative or media issues at all. They are data issues.
Before breaking down the warning signs, here is what clean data flow should look like.
What a Healthy Marketing Data Stack Looks Like
Every stable stack follows the same structure.
Sources flow into processing. Processing flows into destinations. Sources include the website, app, and ad platforms.
Destinations include CRMs, email and SMS tools, ad platforms, and dashboards. Data moves with clear rules. No mystery gaps. No shadow systems. And no manual patchwork.
Martech Audit Pre-Check: Unified Data Checklist
Use this checklist to quickly verify whether a client’s marketing stack is truly connected—or quietly fractured. If more than two items below are unclear or missing, the account is already operating inside a Franken stack.
[ ] Revenue Matches Across Systems
Ad platforms, ecommerce platforms, and the CRM report the same revenue for the same time period.
[ ] Server-Side Tracking Is Active
Conversions are not relying on browser-only tracking that breaks under cookie loss and ad blockers.
[ ] Offline Conversions Sync Back to Ad Platforms
Closed deals and qualified leads are sent back into Meta, Google, and other networks for real optimization.
[ ] There Is a Single Source of Truth
One system defines revenue, CAC, LTV, and churn. Everyone uses the same numbers.
[ ] Reporting Is Automated
Dashboards update without manual CSV exports, copy-paste work, or fragile formulas.
[ ] Data Flows Both Directions Between Key Tools
CRM status, support events, and product usage feed back into marketing platforms—not just one way.
[ ] Lifecycle Tools Use Real Behavior, Not Just Page Views
Email and SMS trigger from purchases, usage, churn risk, and support—not vanity activity.
[ ] Event Tracking Has Clear Naming and Standards
No duplicated, vague, or undocumented events polluting reports and dashboards.
[ ] APIs and Integrations Are Actively Maintained
No expired tokens, abandoned middleware, or silent sync failures.
[ ] There Is a Named Owner of the Stack
One person or team is responsible for uptime, data quality, and system integrity.
[ ] New Tools Require a Data Impact Review
No tools are added without mapping how data will flow in and out.
[ ] Attribution Logic Is Documented
Everyone uses the same rules for conversions, revenue, and credit—no debates in reporting meetings.
Are you scaling a strategy? Or a “Frankenstack”?
Download the Autonomous Agency Martech Health Checklist
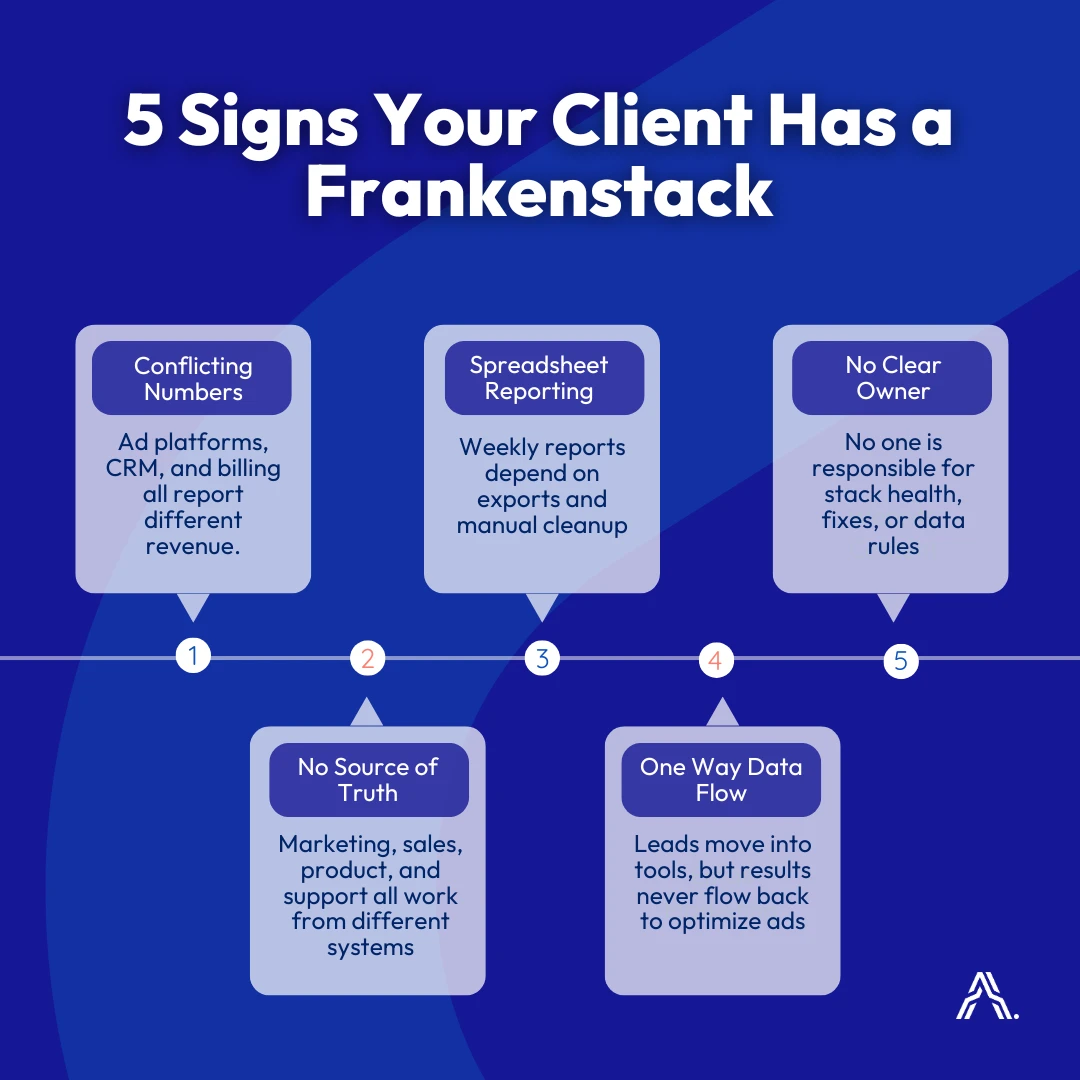
1. Ad Platforms and the CRM Show Different Revenue
This usually happens due to:
- Client side tracking only
- Missing server side events
- Delayed conversion syncing
- Reporting eats hours
- Offline conversions never sent back
You optimize toward weak signals. Budgets stay capped because leaders do not trust the data. Every performance review becomes a debate instead of a decision.
2. Ad Platforms and the CRM Show Different Revenue
Ask three people at the client for the same metric and you get three answers.
Revenue lives in Stripe.
Leads live in HubSpot.
Product usage lives in the app.
Nothing rolls up into one place with shared rules. Reporting turns into interpretation instead of fact.
Cohort analysis becomes guesswork. LTV and CAC lose meaning. Forecasts miss targets. Retention work operates without clarity.
3. Reporting Still Depends on Spreadsheets
If your team exports CSV files every week, the stack is already cutting into your margin.
Manual reporting usually means:
- Google Sheets as the primary dashboard
- Data pulled from each platform by hand
- Formulas only one person understands
- Broken or stale charts
This setup does not scale. It only survives.
Account managers lose hours every week. Errors slip into decks. Growth in reporting requires more headcount. Client trust in the numbers slowly erodes.
4. Key Tools Only Send Data One Way
Many stacks send data in only one direction.
Leads flow from ads into the CRM. But CRM status updates never flow back into ad platforms.
Support tickets live in Zendesk. But marketing never sees customer risk flags.
Product usage lives in the app. But lifecycle tools never receive those signals.
When data flows only one way, optimization always lags behind reality.
Ad platforms train on weak data. Lifecycle messages fire at the wrong time. Upsell and cross sell timing misses opportunity.
5. No One Owns the Stack
This is the quiet killer.
Ask who owns the data stack and you often hear:
- A former contractor built it
- A vendor handled it
- Maybe IT
- Not sure
When ownership is unclear, decay is guaranteed.
Tags break and no one fixes them. APIs expire without warning. New tools get added without planning.
Six months later the mess is worse than before.
Small issues turn into full rebuilds. Every new integration takes twice as long. Risk grows silently.
The True Cost of a Frankenstack
When these issues stack on top of each other, the damage compounds.
What we routinely see:
- 20 to 30 percent revenue under reporting from missing server side events
- Paid media optimized on partial signals
- Lifecycle programs driven by page views instead of behavior
- Reporting that lags reality by days
- Agencies absorbing unpaid technical cleanup
From the client side, growth feels inconsistent. From the agency side, pressure builds. Very few teams trace the slowdown back to the stack.
How Agencies Use the MarTech Stack Blueprint
This is where the Blueprint becomes leverage, not just an audit.
You share the current tool list. We map the real data flow. We highlight the breaks. And you walk into the client meeting with clarity and control.
Agencies use it in three clear steps.
Step 1. The Visual Map That Drives Buy In
Clients respond to visuals faster than technical audits. They see where data starts, how it moves, and where it stops. Green lines show what works. Red lines show what is broken or missing. The gaps speak for themselves.
Step 2. The Risk Report That Creates Urgency
Each break is tied to a business impact such as:
- Under reported ROAS
- Slow lead follow up
- Marketing sent to unhappy customers
- Inaccurate revenue reporting
Fear creates urgency. Urgency creates a budget.
Step 3. The Future State That Supports the Upsell
You do not just point out problems. You show a cleaner setup the client can move toward.
Clear event tracking rules. Clean data storage. Lifecycle tools driven by real usage. Live dashboards that update automatically.
You sell the plan. We handle the technical execution.
What a Typical Execution Plan Looks Like
Most fixes follow the same simple structure.
1st Phase focuses on tracking and attribution.
2nd Phase aligns the CRM and cleans data.
3rd Phase automates dashboards and reporting.
Clients get quick wins and visible progress. Agencies gain defined scope and cleaner delivery.
The Bottom Line
Every hour your team spends wrestling with broken systems is an hour taken from creative, media, and strategy work that clients actually pay you for. Treat technical setup as a core discipline, not a favor. Your margins, your results, and your reputation depend on it.