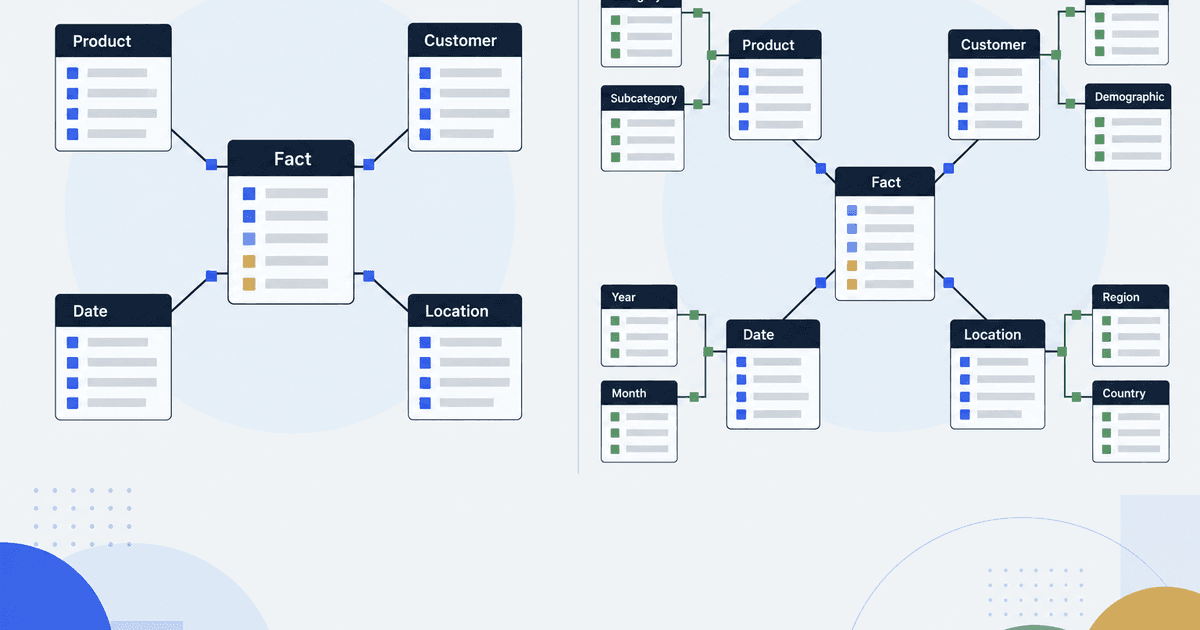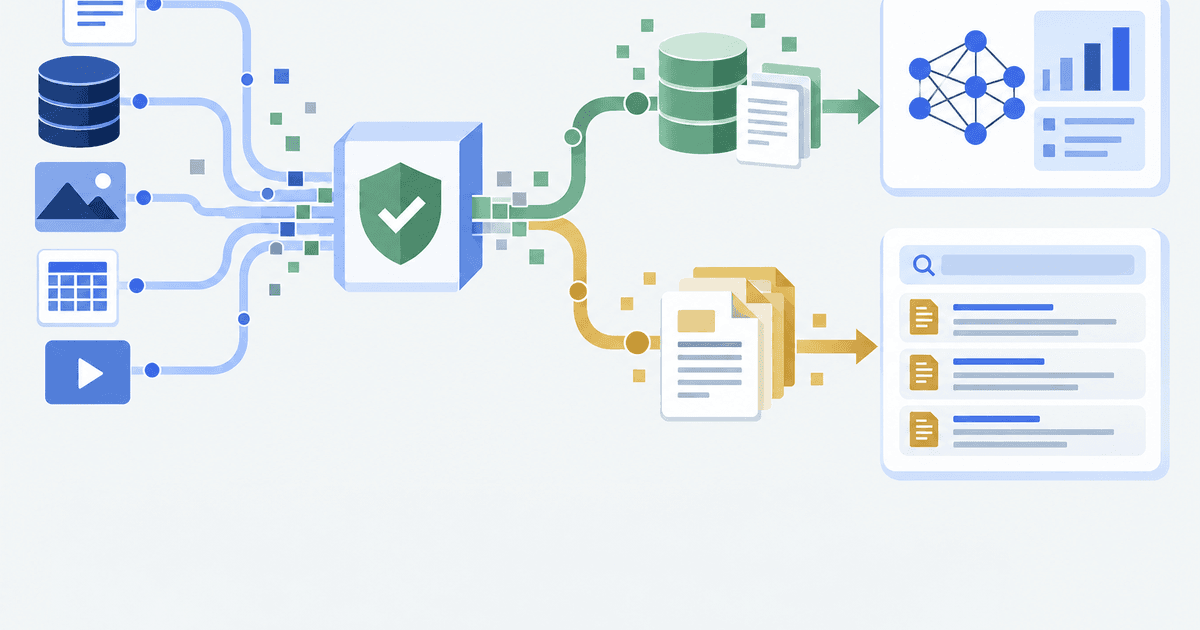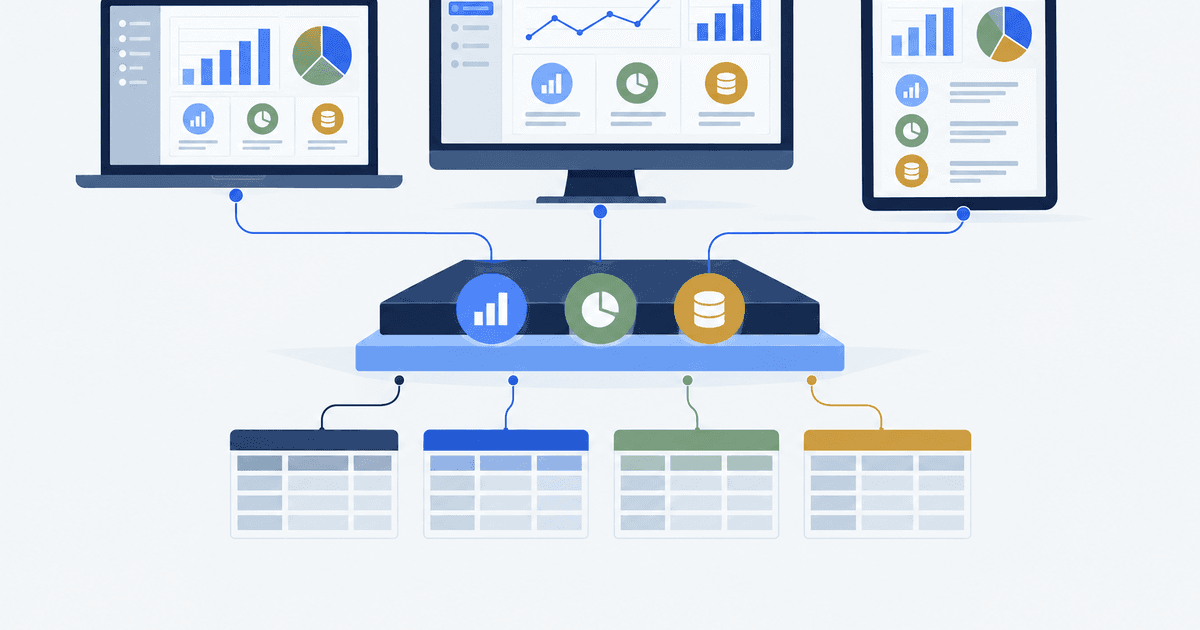
A leadership team opens three dashboards. They see three revenue numbers for the same week. Nobody is lying. Each chart joins different tables, drops different orders, or reads a different clock. A fourth chart will not settle it.
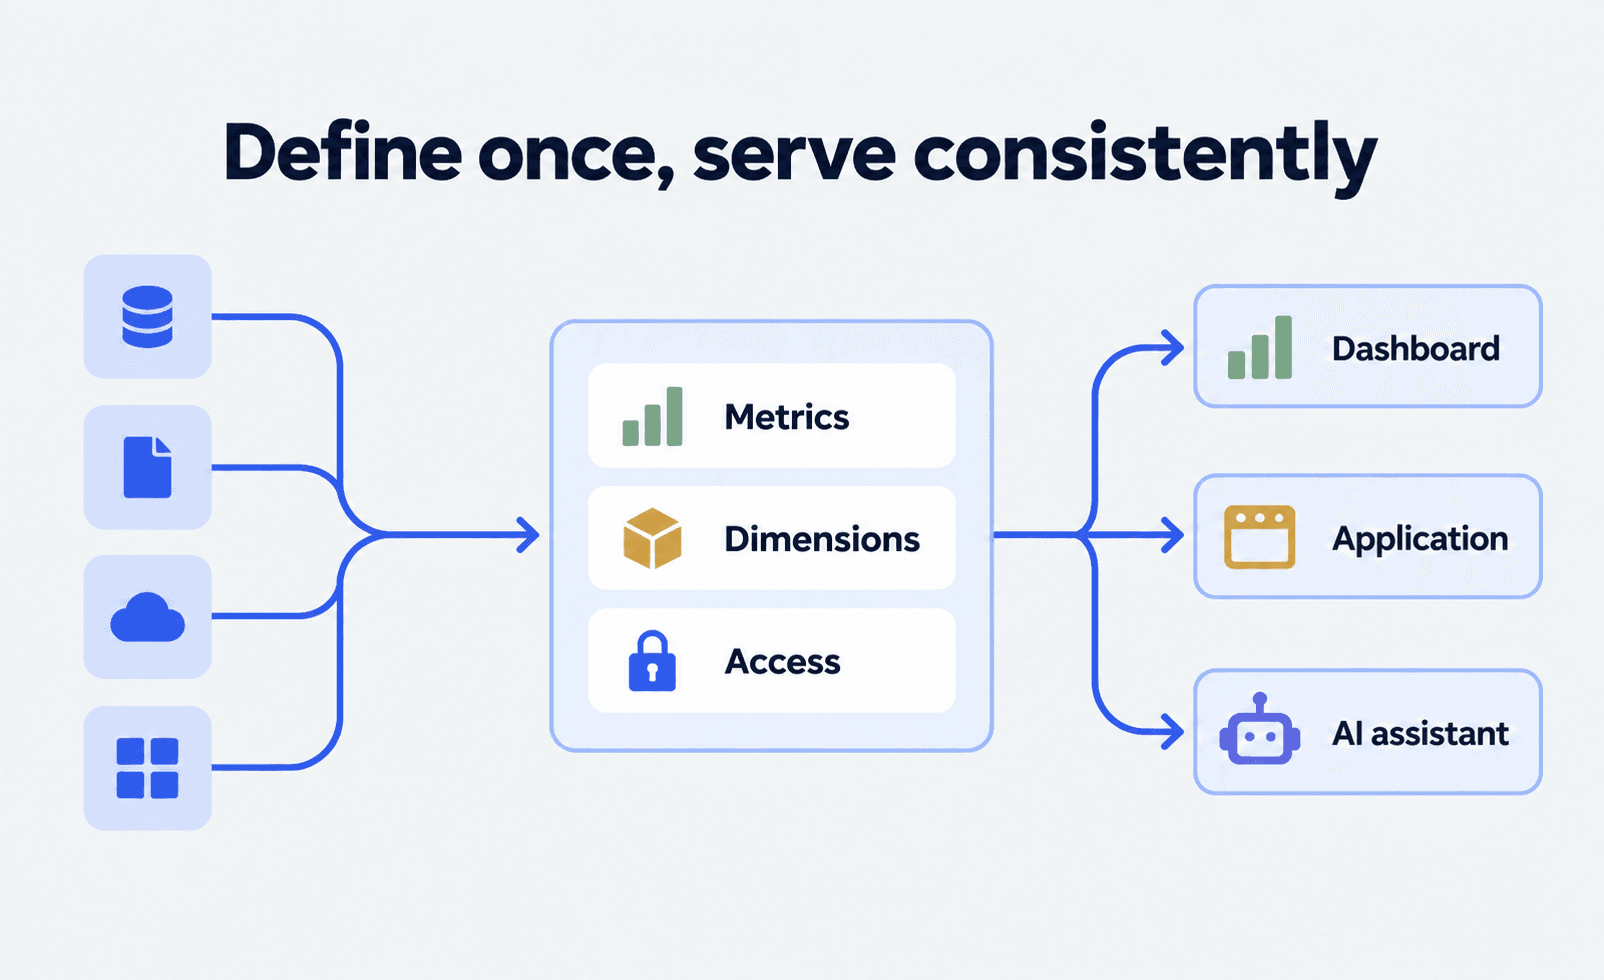
The direct answer. A semantic layer is a shared rulebook for business terms. It sets out what net revenue, active customer and stock on hand mean. It also sets out how each one may be sliced. Reports, apps and chat tools then ask for the same meaning, instead of each building its own.
The cost of going without one is the week a month your team spends arguing about which number is right. Autonomous Technologies builds and runs the systems behind Shopify stores, for founders and operators who own the store after launch. Our ecommerce analytics work starts at the definitions, not the dashboard, because that is where the lost week comes back.
A semantic layer makes the chosen rule reusable and easy to check. It cannot make a wrong rule right. It cannot fix bad source data. It cannot settle a business argument for you. It cannot stop a chat tool answering past its evidence.
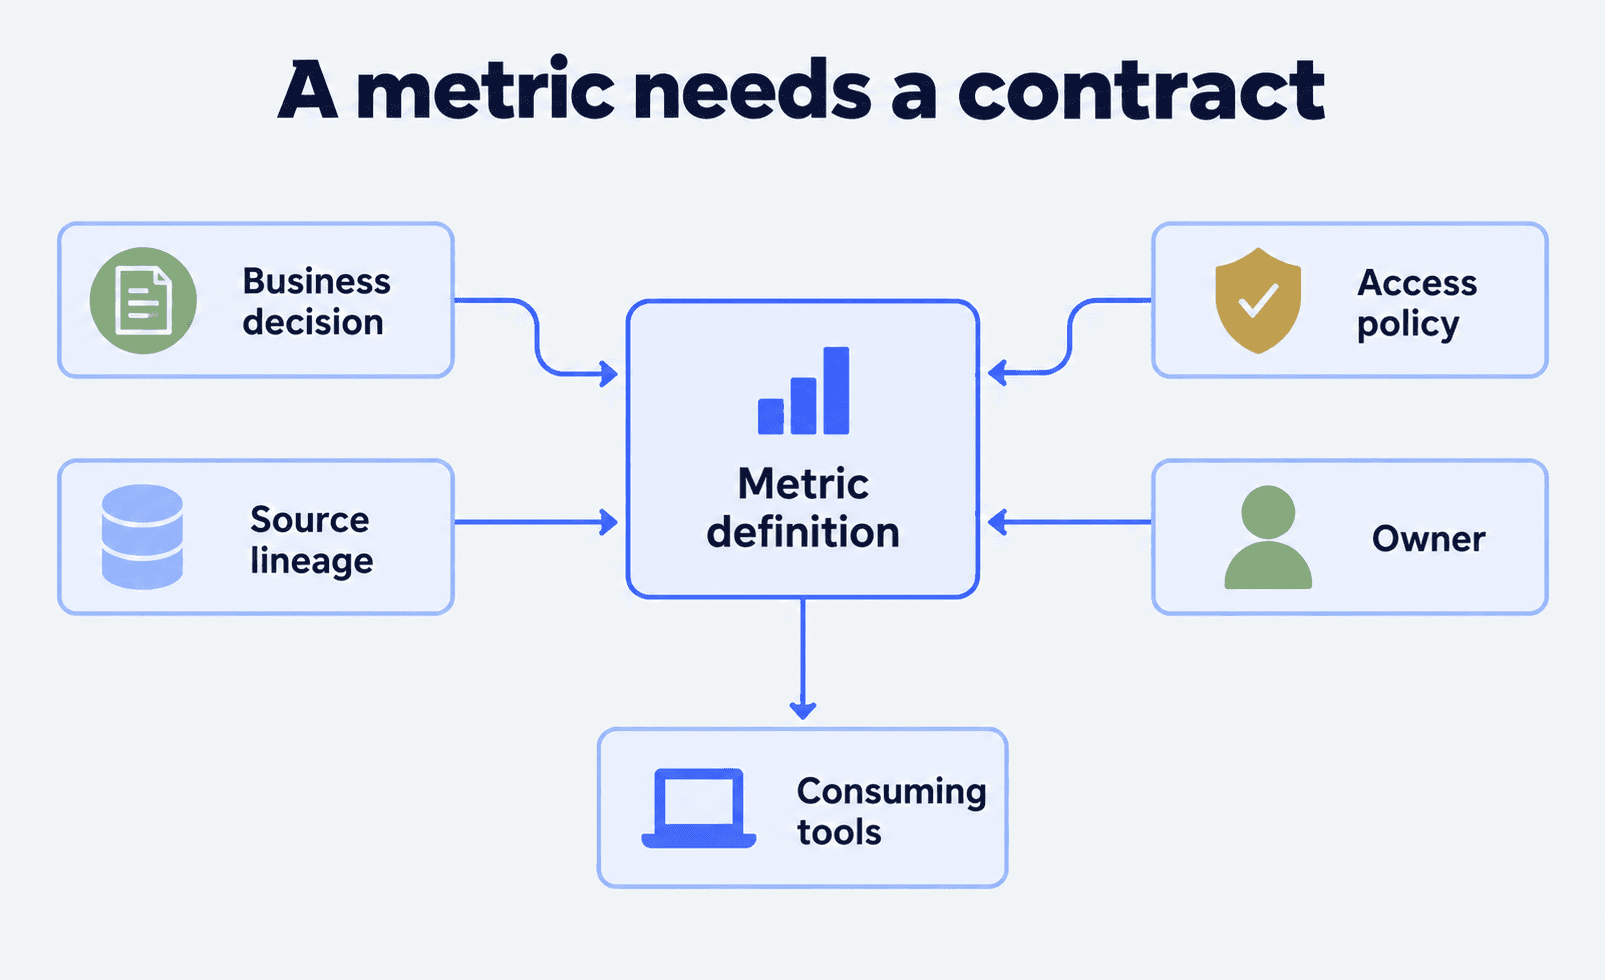
A semantic layer needs business owners, not just data models. It needs named owners, change control, access rules and tests. A metrics file nobody trusts is one more file.
Who this is for, and who it is not for
This is for the analytics lead, data engineer or ops owner with three teams and three revenue numbers. It assumes you already have a warehouse. A warehouse here is the central database your reports read from.
It is not for a team with one source, one report and one owner. Write the query down, name the owner, and spend the months on something else. It is also not a fix for missing or late data. A semantic layer will state that gap in better words. It will not close it.
What belongs in a semantic layer
Setups vary. A useful one names five things. Entities are the nouns, such as customer or order. Measures are quantities you can add up, such as order totals. Metrics are business rules built on measures, such as net revenue. Dimensions are ways to slice, such as country or channel. Rules say which slices are valid.
dbt lets teams write semantic models and metrics in code, then use them across tools (dbt on building a semantic layer). Its reference shows how entities, dimensions and metrics attach to a model (dbt semantic models).
- Element
- Entity
- Example
- Customer, order, product
- Why it matters
- Sets the grain and the join path
- Element
- Metric
- Example
- Net revenue, after approved refunds
- Why it matters
- Makes the business rule reusable
- Element
- Dimension
- Example
- Order date, channel, country
- Why it matters
- Sets how a metric may be sliced
- Element
- Access rule
- Example
- Finance sees margin, regions see their market
- Why it matters
- Keeps the rule inside the right hands
- Element
- Metadata
- Example
- Owner, source, test state, freshness
- Why it matters
- Lets a reader judge if the number is fit to use
| Element | Example | Why it matters |
|---|---|---|
| Entity | Customer, order, product | Sets the grain and the join path |
| Metric | Net revenue, after approved refunds | Makes the business rule reusable |
| Dimension | Order date, channel, country | Sets how a metric may be sliced |
| Access rule | Finance sees margin, regions see their market | Keeps the rule inside the right hands |
| Metadata | Owner, source, test state, freshness | Lets a reader judge if the number is fit to use |
Why chat tools make this urgent
Ask a chat tool for last quarter’s revenue by customer. Several things are still undecided. Booked or recognised. Gross or net. Calendar or fiscal quarter. Which customer record. Which currency. Which orders to drop.
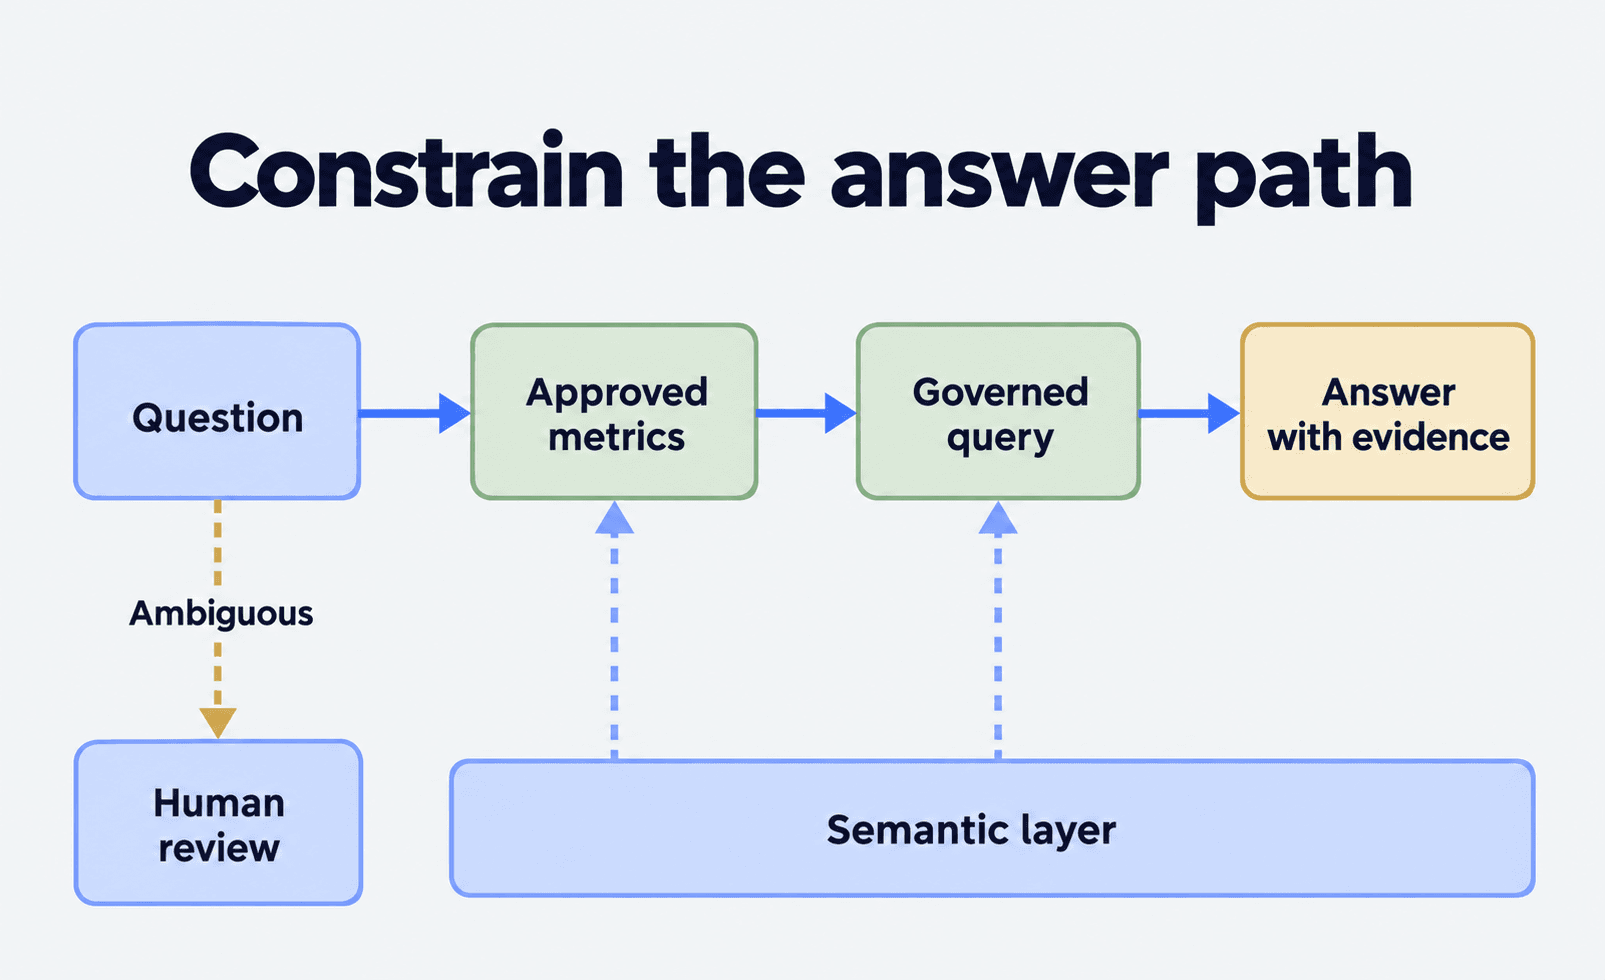
A semantic layer hands the tool the allowed metrics, slices and joins. The answer gets easier to check, because the tool can name the metric and the grain it used. If the same rules run in the tool, it also cannot reach a column you never approved.
That raises the odds of a useful answer. It does not promise one. A tool can still misread the question, pick the wrong slice, or state a claim the query never supported. So add a response rule, query logs, citations, and a human step for costly calls.
One word, several valid numbers
Take revenue at a retailer selling in four markets. Finance wants recognised revenue after returns and tax. Ecommerce wants order value at checkout. Growth wants revenue credited to a campaign inside a chosen window. Operations wants the value of goods shipped. These are four questions, not four mistakes.
Do not hide those differences under one vague metric. Name each one. Write down the formula, the grain and the source. Then expose only the slices that hold. A net sales metric may be sound by order date and market, yet wrong by campaign, because credit arrives days later. That limit is part of the rule.
- Field
- Name
- Example
- net_sales_after_refunds
- Field
- Rule
- Example
- Completed sales less approved refunds, before tax and shipping
- Field
- Grain
- Example
- Order line, rolled up to the slice asked for
- Field
- Clock
- Example
- Order time, in the reporting business timezone
- Field
- Valid slices
- Example
- Market, channel, product, customer type, order date
- Field
- Known limits
- Example
- Refunds land only once the refund event arrives
- Field
- Owner
- Example
- Ecommerce data owner, approved by the finance controller
| Field | Example |
|---|---|
| Name | net_sales_after_refunds |
| Rule | Completed sales less approved refunds, before tax and shipping |
| Grain | Order line, rolled up to the slice asked for |
| Clock | Order time, in the reporting business timezone |
| Valid slices | Market, channel, product, customer type, order date |
| Known limits | Refunds land only once the refund event arrives |
| Owner | Ecommerce data owner, approved by the finance controller |
What a semantic layer cannot fix
These projects fail when the layer is painted over an unsolved data problem. It does not find missing orders. It does not merge split customer records. It does not backfill a late ad feed. It does not undo a bad currency rate. It does not decide whether a cancelled order counts.
It also cannot remove fair disagreement. A warehouse manager and a CFO can both be right about stock or margin. The job is to make each version named, scoped and owned. Then each use picks one on purpose.
“Single source of truth” is too vague to govern. Aim for one approved rule, for one named decision, at one grain, with one owner.
Build it around decisions, not fields
Start with the decisions that keep causing rework. Weekly trading review. Promotion results. Stock risk. Retention. Board reporting. For each, write the question, the user, the action, the metric, the grain, the slices, the source, the lag and the owner. Then find where today’s reports disagree.
This keeps the first pass small. A team that models every column builds a dictionary nobody can check. Pick the few metrics that cross teams and recur. Make them work in the tools people already open. Extend only where demand shows up.
Pick the home that your consumers share
- Approach
- Modelling-tool layer
- Good fit
- You already ship models through code review
- Trade-off
- Consumers need adapters, and owners still need business input
- Approach
- BI-tool metric layer
- Good fit
- One BI product is where decisions happen
- Trade-off
- Rules get stuck in the BI tool and drift from apps
- Approach
- Warehouse-native model
- Good fit
- You want SQL-close rules and warehouse compute
- Trade-off
- Ties you to one platform, and cost needs design
- Approach
- Metrics API
- Good fit
- Many apps and agents need the same rules
- Trade-off
- Adds a platform to own, watch and version
| Approach | Good fit | Trade-off |
|---|---|---|
| Modelling-tool layer | You already ship models through code review | Consumers need adapters, and owners still need business input |
| BI-tool metric layer | One BI product is where decisions happen | Rules get stuck in the BI tool and drift from apps |
| Warehouse-native model | You want SQL-close rules and warehouse compute | Ties you to one platform, and cost needs design |
| Metrics API | Many apps and agents need the same rules | Adds a platform to own, watch and version |
Cube, for example, serves one set of rules to BI tools, embedded analytics and agents through the same APIs (Cube documentation). Ask which consumers must agree. If dashboards, apps and chat tools will not all call the same rule, decide which system owns it. Copying a rule across tools works only with versions and a check.
What breaks, and who owns it
The fair objection is that a semantic layer adds a second place a number can go wrong. True. The answer is not more policy. Name, for each break, who sees it first and who fixes it.
- What breaks
- A feed lands late, so a metric looks whole but is short
- Who owns the fix
- The owner of the source, not the metrics team
- Typical time to spot
- Under 1 day, if freshness sits beside the number
- What breaks
- Two metrics share a name at different grains
- Who owns the fix
- The business owner of that decision
- Typical time to spot
- 2 to 6 weeks, usually in front of an executive
- What breaks
- A rule changes with no version bump
- Who owns the fix
- The approver on the metric contract
- Typical time to spot
- 1 to 2 reporting cycles
- What breaks
- A rule is enforced in 1 tool but not the next
- Who owns the fix
- The platform owner
- Typical time to spot
- 0 warning until a review
- What breaks
- A tool answers past the metric's stated limits
- Who owns the fix
- The team that wrote the metric
- Typical time to spot
- Under 1 minute, if the answer names its metric
| What breaks | Who owns the fix | Typical time to spot |
|---|---|---|
| A feed lands late, so a metric looks whole but is short | The owner of the source, not the metrics team | Under 1 day, if freshness sits beside the number |
| Two metrics share a name at different grains | The business owner of that decision | 2 to 6 weeks, usually in front of an executive |
| A rule changes with no version bump | The approver on the metric contract | 1 to 2 reporting cycles |
| A rule is enforced in 1 tool but not the next | The platform owner | 0 warning until a review |
| A tool answers past the metric's stated limits | The team that wrote the metric | Under 1 minute, if the answer names its metric |
A settled rule outlives the dashboard that prompted it. The signup tracking we merged has run in the client’s live code for 142 days, 17 April to 6 September 2026 (JuristAI measurement rebuild).
Two rules are worth fixing before the first metric ships. Every metric names one approver outside the data team. Every metric shows its freshness and its version where it is read. Neither needs a tool. Both survive a change of vendor.
A staged plan that can earn trust
- Pick one decision that crosses teams, and 3 to 5 metrics that disagree today.
- Write the contracts with the business owners. Grain, source, limits, access, examples.
- Build the jobs, the tests and the lineage before anyone sees the metrics.
- Reconcile one bounded period to an accepted reference. Write down every gap you meant to keep.
- Wire up one dashboard, then test clear and unclear questions against it.
- Watch usage, failures, freshness and rule changes. Widen only once the first surface is trusted.
A semantic layer is worth buying when it cuts repeat interpretation work on real decisions. It is not a stand-in for data ownership. For a related read, see our guide to slow dashboards and data warehouse design.
Start with the definitions, not another dashboard
Take the two reports that disagree, the systems behind them, and the decision each one feeds. That is a morning of work. It tells you whether you have a rule problem or a data problem. The cheapest first move is to see which rules your storefront and its reports use today.
Semantic layers · Project enquiry
Give your data a shared meaning
Share where definitions, metrics, or AI answers are drifting. We will follow up to discuss whether Autonomous can help.
Common questions
Is a semantic layer the same as a data warehouse?
No. A warehouse stores data and runs the query. A semantic layer publishes the business meaning on top of prepared data. Most teams that need one need both.
Does it make a chat tool's answers accurate?
No. It improves the context the tool is given. Accuracy still rests on source quality, the rules themselves, access control, query correctness, and whether a human checks the answer before acting.
Should finance and marketing share one revenue metric?
They should share the words and know exactly when their rules differ. One shared metric is right only when both decisions need the same inclusions, the same clock and the same credit window.
Who should own a metric definition?
One named person in the business area that lives with the decision. The data team owns how it is built. If the only name on a metric sits in the data team, no one can approve a change, and the rule will drift.