A product moves from Accessories to Gifting. The next morning, last quarter’s sales report shows it under Gifting too. The numbers you sent the board a month ago no longer reconcile. Nobody changed a single order.
Two tables and one join decided that. A join is the step that matches rows in one table to rows in another. That is the argument behind star schema and snowflake schema. It is not about elegance.
Which one, and for whom. Use a star schema as the default for any reporting subject area. It keeps the fact grain and the business dimensions visible, and both people and AI tools query it with fewer wrong turns. Snowflake a single dimension only when you can name the shared hierarchy or the maintenance problem it solves.
A star schema and a snowflake schema are two ways to organize the data you report from. That data sits in a warehouse, a database built for reporting rather than for running your store.
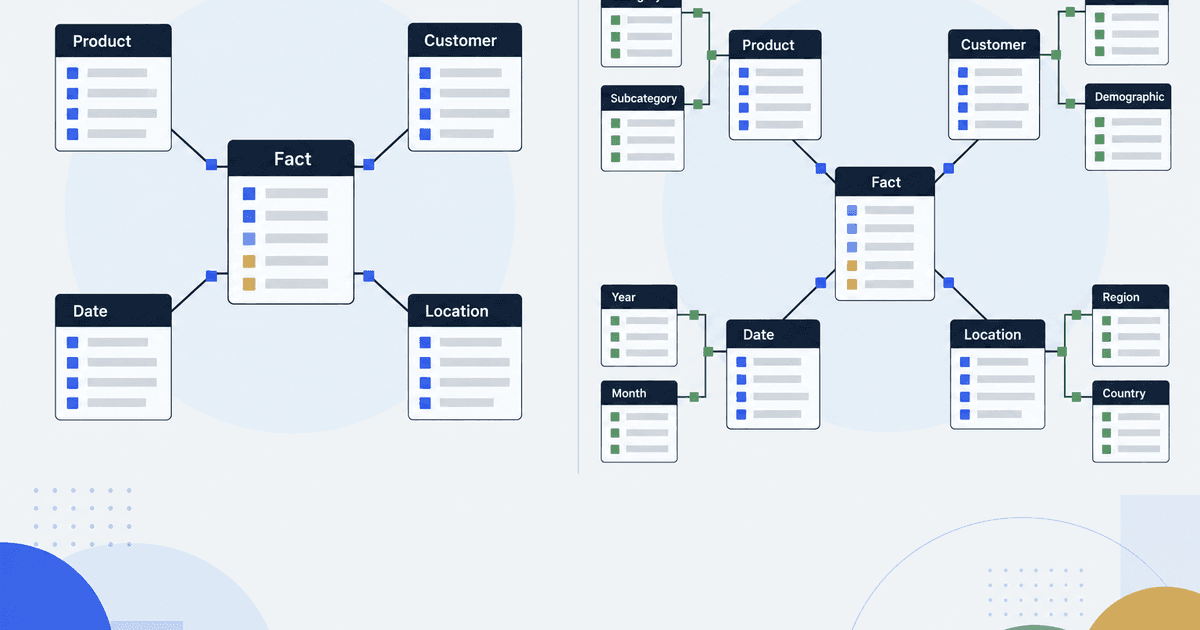
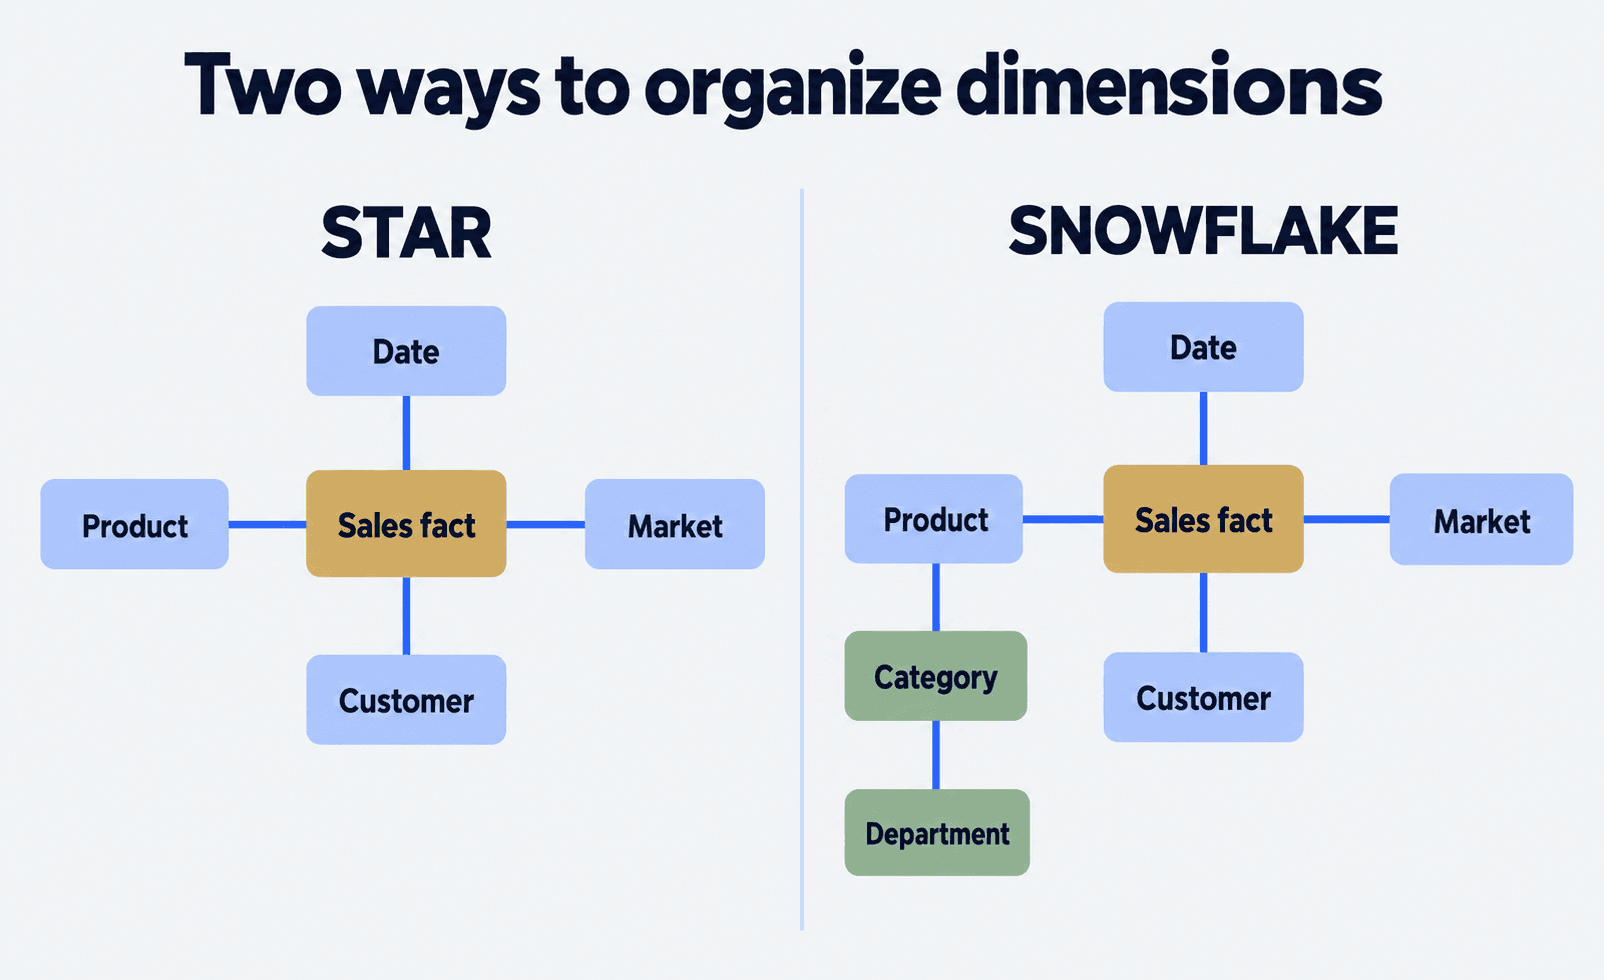
In a star schema, a central fact table connects directly to denormalized dimension tables. In a snowflake schema, some dimensions are normalized into more related tables. Three terms carry those sentences, so define them first.
A fact table stores the events you measure. It holds one row per order line, shipment or session, with the numbers you add up. A dimension table stores what you filter and group by: product, customer, date, market.
Normalization splits repeated values into their own table, so each value is stored once. Denormalization does the opposite. It repeats the value on every row, so nobody has to go looking.
A report that changes after you sent it costs you a day of reconciling and some of the board’s trust. Autonomous Technologies is an engineering firm. We build and run the data and reporting systems behind Shopify stores and ecommerce businesses, for founders and operators who answer for the numbers after launch. Our ecommerce analytics work starts with the metric, not the shape of the tables. That is where the lost day comes back.
One naming trap. A snowflake schema is a modelling pattern, not the Snowflake cloud platform. You can build a star schema on Snowflake, BigQuery, Databricks or Redshift, which are all cloud data platforms.
This is for the person who owns the report, not the vendor shortlist
Read this if you own a warehouse or a BI (business intelligence) layer that more than one team queries. That layer is the dashboards and reporting tools. Read it too if you are about to reshape a dimension. Read it if you are being asked to point an AI assistant at your tables.
It is written for the operator who gets the message when a number looks wrong on a Monday.
Skip this if you have one source system and a handful of reports. Skip it too if you have no plan to let anything write its own SQL. SQL (Structured Query Language) is the code that asks a database questions.
One well-named table will serve you better. Come back when a second team asks for the same metric.
Model for the business question and query workload. A perfectly normalized dimension that nobody can use correctly is not a better analytical model.
The difference at a glance
- Decision factor
- Dimension design
- Star schema
- One wide, flat table per dimension.
- Snowflake schema
- Fields split into linked tables.
- Decision factor
- Query shape
- Star schema
- The fact table joins straight to dimensions.
- Snowflake schema
- A query may hop through several tables.
- Decision factor
- Analyst experience
- Star schema
- Easier to find and use.
- Snowflake schema
- Needs more join and tree knowledge.
- Decision factor
- Storage
- Star schema
- Repeats the tree fields on every row.
- Snowflake schema
- Stores each tree value once.
- Decision factor
- Change management
- Star schema
- One change can touch a wide table.
- Snowflake schema
- One place to change, more things that depend on it.
- Decision factor
- Common fit
- Star schema
- Dashboards, ad hoc work, semantic layers.
- Snowflake schema
- Shared master-data trees, reused across subject areas.
- Decision factor
- Main risk
- Star schema
- Unclear grain, and repeated values nobody owns.
- Snowflake schema
- Wrong joins, slow queries, and hidden links.
| Decision factor | Star schema | Snowflake schema |
|---|---|---|
| Dimension design | One wide, flat table per dimension. | Fields split into linked tables. |
| Query shape | The fact table joins straight to dimensions. | A query may hop through several tables. |
| Analyst experience | Easier to find and use. | Needs more join and tree knowledge. |
| Storage | Repeats the tree fields on every row. | Stores each tree value once. |
| Change management | One change can touch a wide table. | One place to change, more things that depend on it. |
| Common fit | Dashboards, ad hoc work, semantic layers. | Shared master-data trees, reused across subject areas. |
| Main risk | Unclear grain, and repeated values nobody owns. | Wrong joins, slow queries, and hidden links. |
The choice that matters is how facts, dimensions and grain fit the decisions you have to make. Kimball Group dimensional modelling techniques
Start with the fact table grain
One decision comes before star versus snowflake. State what one row in the fact table means. That is the grain.
The grain might be one order line, one daily stock count, one session, one shipment, or one invoice line. It decides what you can add up, which dimensions apply, and how facts join.
No amount of normalization fixes an unclear grain. For example, an fct_order_line table at order-line grain might hold quantity, merchandise sales, discount and refunded amount. It links to date, product, customer, market, channel and order.
A report that needs orders, not lines, needs one of two things. One is a summary table, called an aggregation. The other is a defined distinct count that counts each order once.
- Model element
- Fact table
- Example
- fct_order_line
- Design question
- Does one row mean one order line after each valid adjustment?
- Model element
- Date dimension
- Example
- dim_date
- Design question
- Which business timezone and fiscal calendar apply?
- Model element
- Product dimension
- Example
- dim_product
- Design question
- Should historical reporting preserve the product fields at sale time?
- Model element
- Customer dimension
- Example
- dim_customer
- Design question
- Which identity and account hierarchy are valid for this report?
- Model element
- Market dimension
- Example
- dim_market
- Design question
- Is market inferred at order time, shipping destination or storefront?
- Model element
- Channel dimension
- Example
- dim_channel
- Design question
- Are channels source facts or an attributed classification?
| Model element | Example | Design question |
|---|---|---|
| Fact table | fct_order_line | Does one row mean one order line after each valid adjustment? |
| Date dimension | dim_date | Which business timezone and fiscal calendar apply? |
| Product dimension | dim_product | Should historical reporting preserve the product fields at sale time? |
| Customer dimension | dim_customer | Which identity and account hierarchy are valid for this report? |
| Market dimension | dim_market | Is market inferred at order time, shipping destination or storefront? |
| Channel dimension | dim_channel | Are channels source facts or an attributed classification? |
What a star schema optimizes for
A star schema gives you and your tools a direct path from the event to its description. For net sales by category and market, an analyst joins the fact table to dim_product and dim_market. Then they group by what they need.
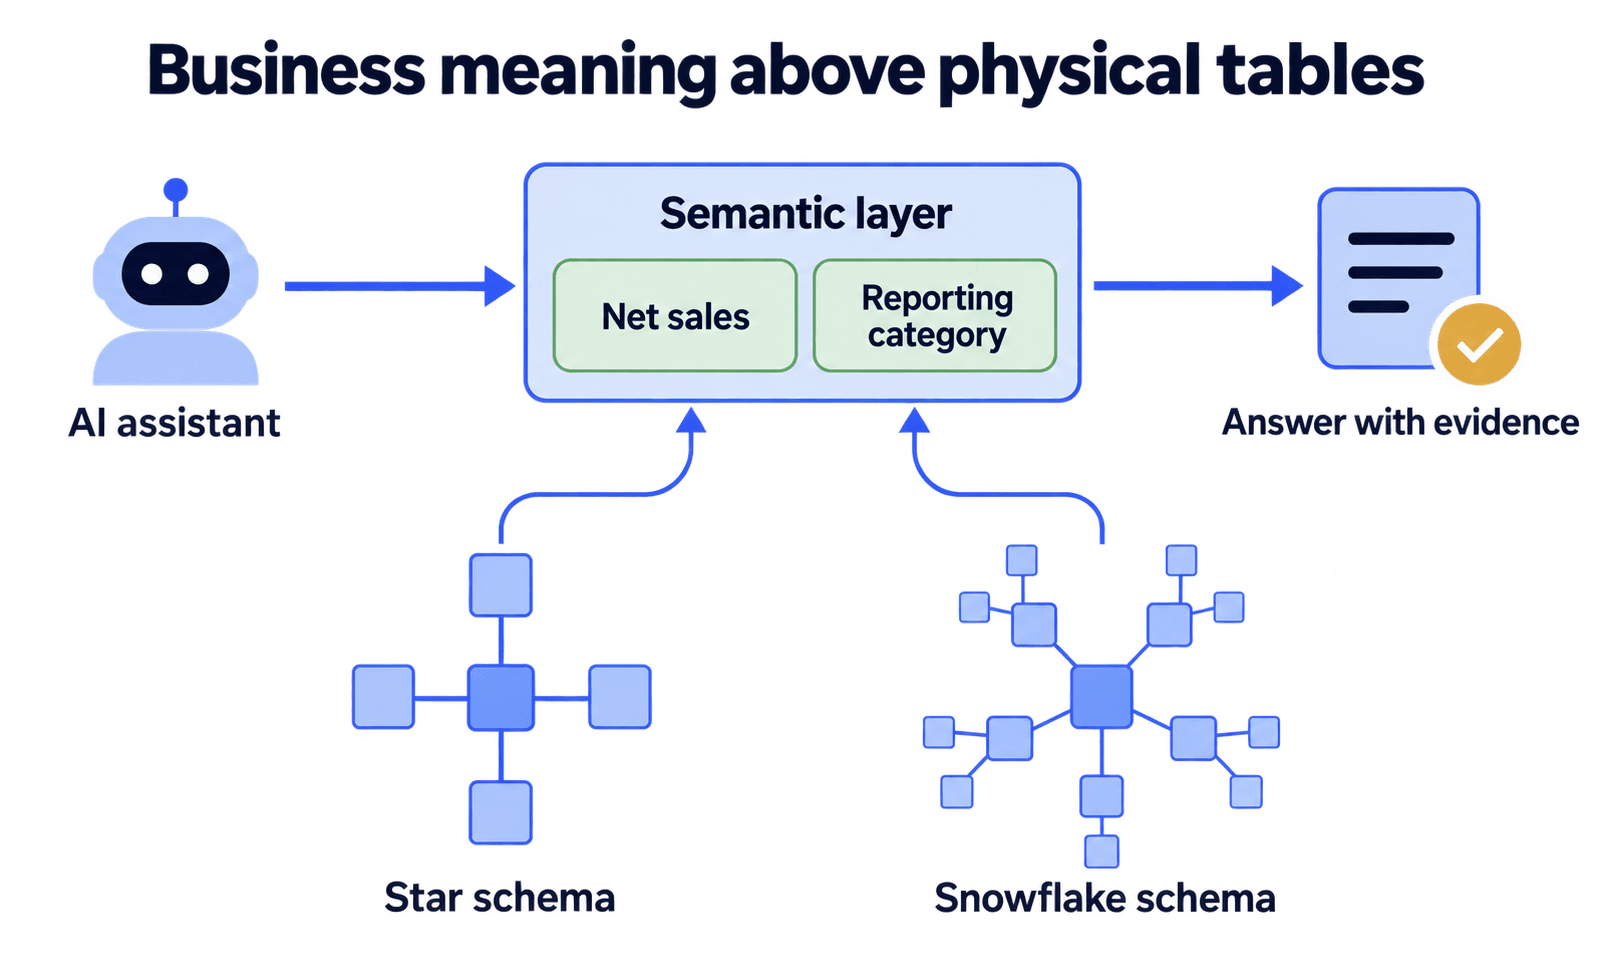
A semantic layer is the approved list of metrics and dimensions between the warehouse and the tools. It can hide those joins behind named metrics. The flat shape still helps when you debug.
Flat dimensions repeat fields. A product table may carry category, department, brand and supplier group on every row. In a modern warehouse, that storage cost is a fair trade for letting people answer their own questions.
The bigger cost is keeping the table right when the category tree changes. A tree is the parent-and-child levels, such as department, then category, then product. History is where it bites.
A slowly changing dimension keeps the old row and adds a new one. A past event then still reports under the description it carried at the time.
Star schemas work well when people report straight from the dimension. They make it easy to list valid fields, limit join paths and show where a number came from.
What snowflaking optimizes for
A snowflake schema stores each tree value once. It also puts a shared category or region tree under one owner. It does this by breaking the dimension tree apart.
Instead of putting product, brand, subcategory and category fields in dim_product, you split them out. A product table links to a brand table and a category tree.
That fits when several subject areas share one controlled tree. It also helps when a wide dimension is hard to keep right. It is a poor trade when every dashboard must rebuild three joins to show a category name.
Microsoft’s dimensional-model guidance sets out the same tradeoff. It treats a snowflake dimension as the exception, not the default. Snowflaking does not on its own improve query performance.
Warehouse optimizers matter, and so do storage layout, caching and query patterns. An optimizer is the part that plans how a query runs. Snowflaking also adds relationships that you must understand, test and document.
Benchmark the actual workload with real concurrent use. Concurrent use means many people querying at once. Do not choose from a rule of thumb.
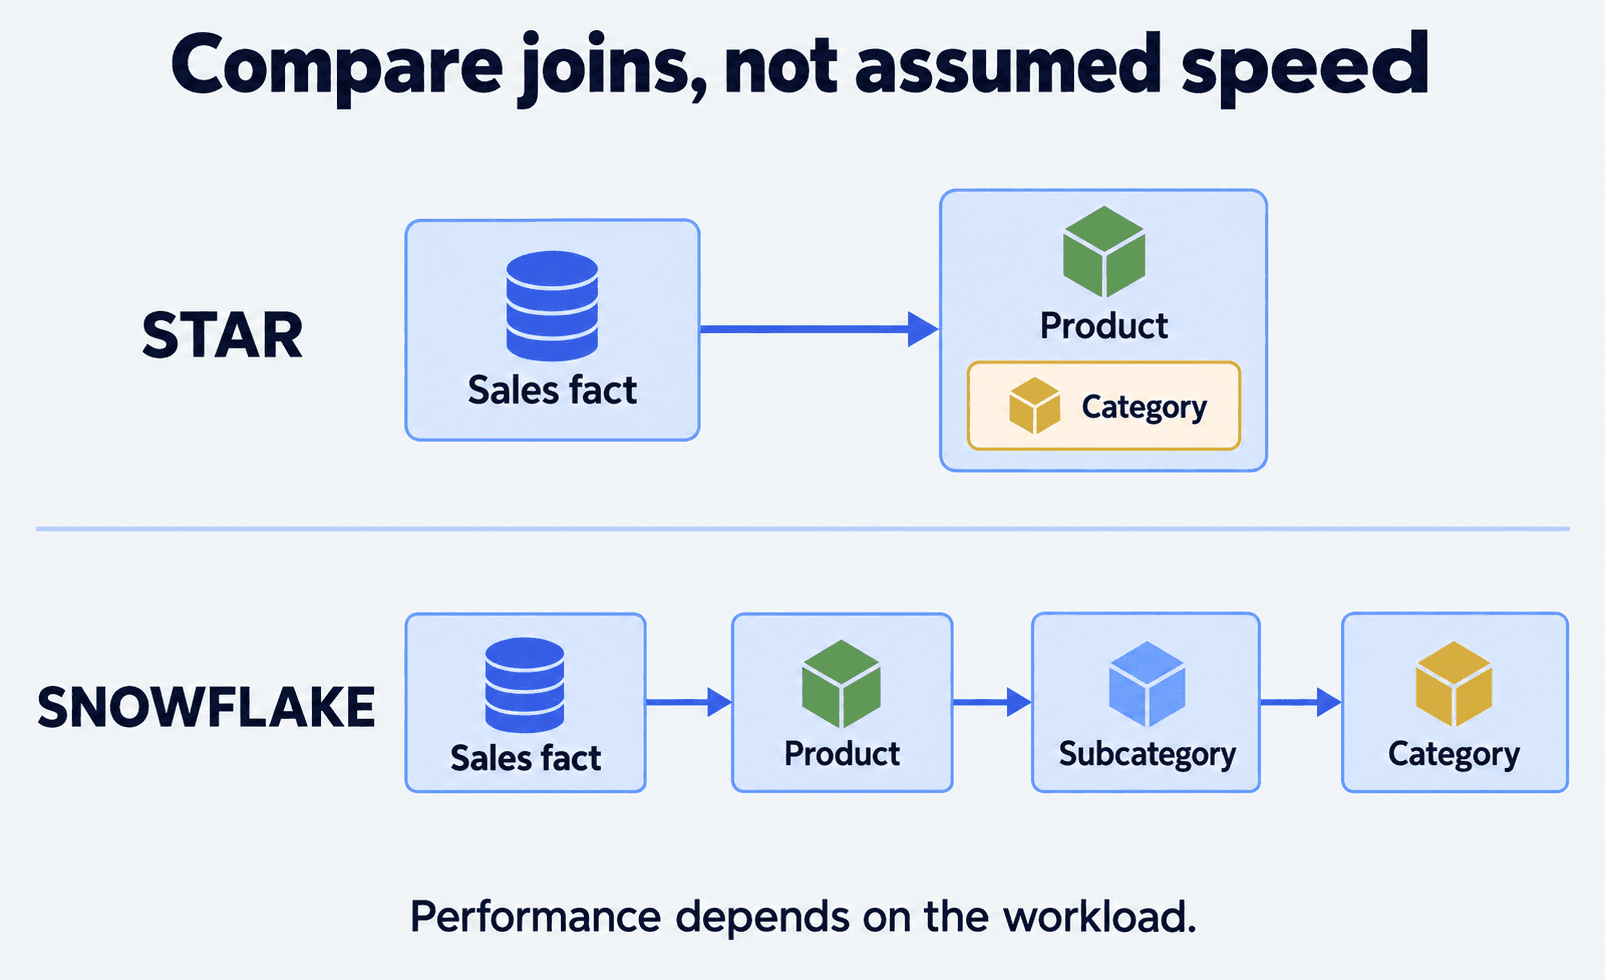
Count the joins before you count the tables
Take “net sales by category in Canada last month” against the two models drawn above.
- For one question: net sales by category, Canada, last month
- Tables the query touches.
- Star model
- 3
- Snowflake model
- 5
- For one question: net sales by category, Canada, last month
- Joins the query declares.
- Star model
- 2
- Snowflake model
- 4
- For one question: net sales by category, Canada, last month
- Join paths that can double the fact.
- Star model
- 2
- Snowflake model
- 4
- For one question: net sales by category, Canada, last month
- Rows to change on a rename.
- Star model
- every product row in it.
- Snowflake model
- 1 row
- For one question: net sales by category, Canada, last month
- People who must know the path.
- Star model
- 1
- Snowflake model
- 1, plus whoever owns the tree.
| For one question: net sales by category, Canada, last month | Star model | Snowflake model |
|---|---|---|
| Tables the query touches. | 3 | 5 |
| Joins the query declares. | 2 | 4 |
| Join paths that can double the fact. | 2 | 4 |
| Rows to change on a rename. | every product row in it. | 1 row |
| People who must know the path. | 1 | 1, plus whoever owns the tree. |
Neither column wins. The star model moves the work to whoever maintains the dimension. The snowflake model moves it to whoever writes the query, and to every tool writing one for them.
The AI and semantic-layer implications
AI analytics tools and semantic layers need clear definitions of customers, products and orders. They also need your metrics and the valid join paths.
A star schema often makes this easier. Fact-to-dimension links are direct, and dimensions present known business fields.
Limit the AI to approved metrics and dimensions. Do not ask it to infer a chain of joins from table names.
A snowflake schema can work well too. It works best when the semantic layer exposes a curated business model above the normalized tables. The key is to stop the AI navigating ambiguous relationships on its own.
Define the valid path and the cardinality, meaning whether one row matches one or many rows on the other side. Define the effective dates and the metric grain too. With costly answers, return the metric definition, the generated query and how recent the data is.
Neither schema makes AI output trustworthy on its own. The assistant returns a polished wrong answer from either shape if the data feed is late. It does the same if records cannot be matched to one customer, or the revenue rule is in dispute.
The durable part is the definition, not the diagram. On JuristAI’s measurement rebuild we agreed the event and its meaning before anything was wired. The signup tracking we merged has run in live client code for 142 days, 17 April to 6 September 2026.
A worked example: product hierarchy for commerce reporting
Take the question: “Which product categories lost net sales in Canada last month, after refunds?”
In a star model, the query is simple. fct_order_line joins straight to dim_product and dim_market. The product table carries the reporting category.
The semantic layer offers net_sales_after_refunds, reporting_category, market and order_date. The product dimension still needs a set process for category changes and for history.
A snowflake model keeps the category hierarchy, with one owner, in one place. The order line joins to product, then subcategory, then category.
Market may pass through a chain of region tables too. The semantic layer should still expose one approved reporting_category, rather than make every consumer rebuild it.
What we saw in a real warehouse
A client’s event warehouse holds one table per event: page view, product viewed, product added, checkout started, order completed. Every table joins on one visitor id.
There is no product dimension, no date dimension and no currency dimension. It is a star with the dimensions left out. It worked until the first money question.
On 20 May 2026 the first average order query on a Pakistani athleisure store returned PKR 104. One sampled order showed why. Its total was 13,600 and its two line items were 7,100 and 6,500.
The money columns held whole rupees. The same columns hold cents for a US dollar store.
The unit rule lived in a note, not in any table. Corrected, the average order was PKR 10,430 and the median 7,350.
- Stage
- Visited
- Visitors
- 1,449
- Drop from the stage before
- Stage
- Viewed a product
- Visitors
- 1,130
- Drop from the stage before
- 22%
- Stage
- Added to cart
- Visitors
- 62
- Drop from the stage before
- 95%
- Stage
- Started checkout
- Visitors
- 29
- Drop from the stage before
- 53%
- Stage
- Completed an order
- Visitors
- 9
- Drop from the stage before
- 69%
| Stage | Visitors | Drop from the stage before |
|---|---|---|
| Visited | 1,449 | |
| Viewed a product | 1,130 | 22% |
| Added to cart | 62 | 95% |
| Started checkout | 29 | 53% |
| Completed an order | 9 | 69% |
The lesson is the one this whole piece makes. The shape of the tables did not cause the bad number. A missing definition did.
A currency dimension would have caught it before anyone read PKR 104 out loud. So would one net_sales measure with a single owner that divides by the right unit.
Failure modes and how to detect them
- Failure mode
- Double-counted facts
- Why it happens
- A one-to-many join blows up an order line.
- What to test
- Check row counts and sums on each side of every join.
- Failure mode
- Wrong historical category
- Why it happens
- Today's fields overwrite what was true at the sale.
- What to test
- Pick a slow-change or snapshot rule. Test it on a rename you know about.
- Failure mode
- Unclear grain
- Why it happens
- Orders, lines and refunds are mixed in one table.
- What to test
- State the grain in every fact model. Test the sums at line level.
- Failure mode
- Snowflaked maze
- Why it happens
- There are now many join routes and no map.
- What to test
- Publish the approved joins. Hide the raw tables from most users.
- Failure mode
- Wide dimension drift
- Why it happens
- Repeated fields stop agreeing with each other.
- What to test
- Build from one source. Test for unique keys and clean references.
- Failure mode
- AI guesses the join
- Why it happens
- The tool infers links from table names.
- What to test
- Expose only named metrics and dimensions. Then read the queries.
| Failure mode | Why it happens | What to test |
|---|---|---|
| Double-counted facts | A one-to-many join blows up an order line. | Check row counts and sums on each side of every join. |
| Wrong historical category | Today's fields overwrite what was true at the sale. | Pick a slow-change or snapshot rule. Test it on a rename you know about. |
| Unclear grain | Orders, lines and refunds are mixed in one table. | State the grain in every fact model. Test the sums at line level. |
| Snowflaked maze | There are now many join routes and no map. | Publish the approved joins. Hide the raw tables from most users. |
| Wide dimension drift | Repeated fields stop agreeing with each other. | Build from one source. Test for unique keys and clean references. |
| AI guesses the join | The tool infers links from table names. | Expose only named metrics and dimensions. Then read the queries. |
Where this breaks: the schema is rarely the thing you are arguing about
Teams redesign the schema and the reports still disagree, because the disagreement was never structural. That is the objection worth taking seriously.
Three things cause most of it.
The first is the metric: net sales can include or exclude shipping, tax, discounts, refunds, exchanges and cancelled orders. Two teams can each be consistent and still report different totals. Neither a star nor a snowflake decides that for you.
The second is history. After a category rename, somebody must say whether last quarter reports under the old name or the new one. That is a policy decision with a named owner, not a join.
The third is timezone and month-end close, when finance finalises the books. A “last month” on UTC will never match a “last month” on the finance calendar. UTC (Coordinated Universal Time) is the global standard clock.
The schema becomes the real question only once those three are settled and people still guess. A useful test: write the five questions the business asks every week. For each one, name the metric, the grain, the definition owner and the approved join path.
If you cannot fill that in, reshaping tables will not help. If you can, and a category name is still three joins away, you have a modelling problem worth fixing.
One more trap. Do not normalize because duplication looks inelegant. Do not denormalize because stars are familiar. Build a small model, run the real reports, reconcile the outputs, then watch a new analyst use it.
Procurement questions for a warehouse or data-platform team
- Which decisions need self-service slicing, and at what grain?
- Which query patterns and volumes will you benchmark?
- Which dimensions are shared trees, and who owns their changes?
- How does the model hold history when a category changes?
- Which joins are approved, and what test stops fact doubling?
- What happens to live dashboards when a dimension is reshaped?
Your next step is one question, written down properly
Pick the single report that causes the most argument. Write its metric definition, its grain, the owner of that definition and the join path it is allowed to use. If performance is driving the redesign, start with our guide to slow dashboards and data warehouse design instead.
Warehouse schema design · Project enquiry
Shape a warehouse around real decisions
Tell us what the warehouse needs to answer and where the current model slows the team down. We will follow up to discuss whether Autonomous can help.
Common questions
Is a snowflake schema only for the Snowflake platform?
No. A snowflake schema is a dimensional-modelling pattern in which dimensions are normalized into related tables. It can run on any suitable analytical database or warehouse, like BigQuery, Databricks and Redshift.
Can a semantic layer hide the difference between star and snowflake schemas?
It can present a consistent business interface above either model. A semantic layer is the governed list of approved metrics and dimensions that sits between the warehouse and the tools. The underlying joins, grain and historical rules still need to be correct and tested.
How do I keep last quarter's report from changing when a product is recategorised?
Decide the policy first, then build to it. Either keep the old dimension row and add a new one so past events report under their original category, or store the category on the fact row at the time of sale. Test the rule against a rename you already know happened.